Research prototype · ongoing
Reliance Under Disruption
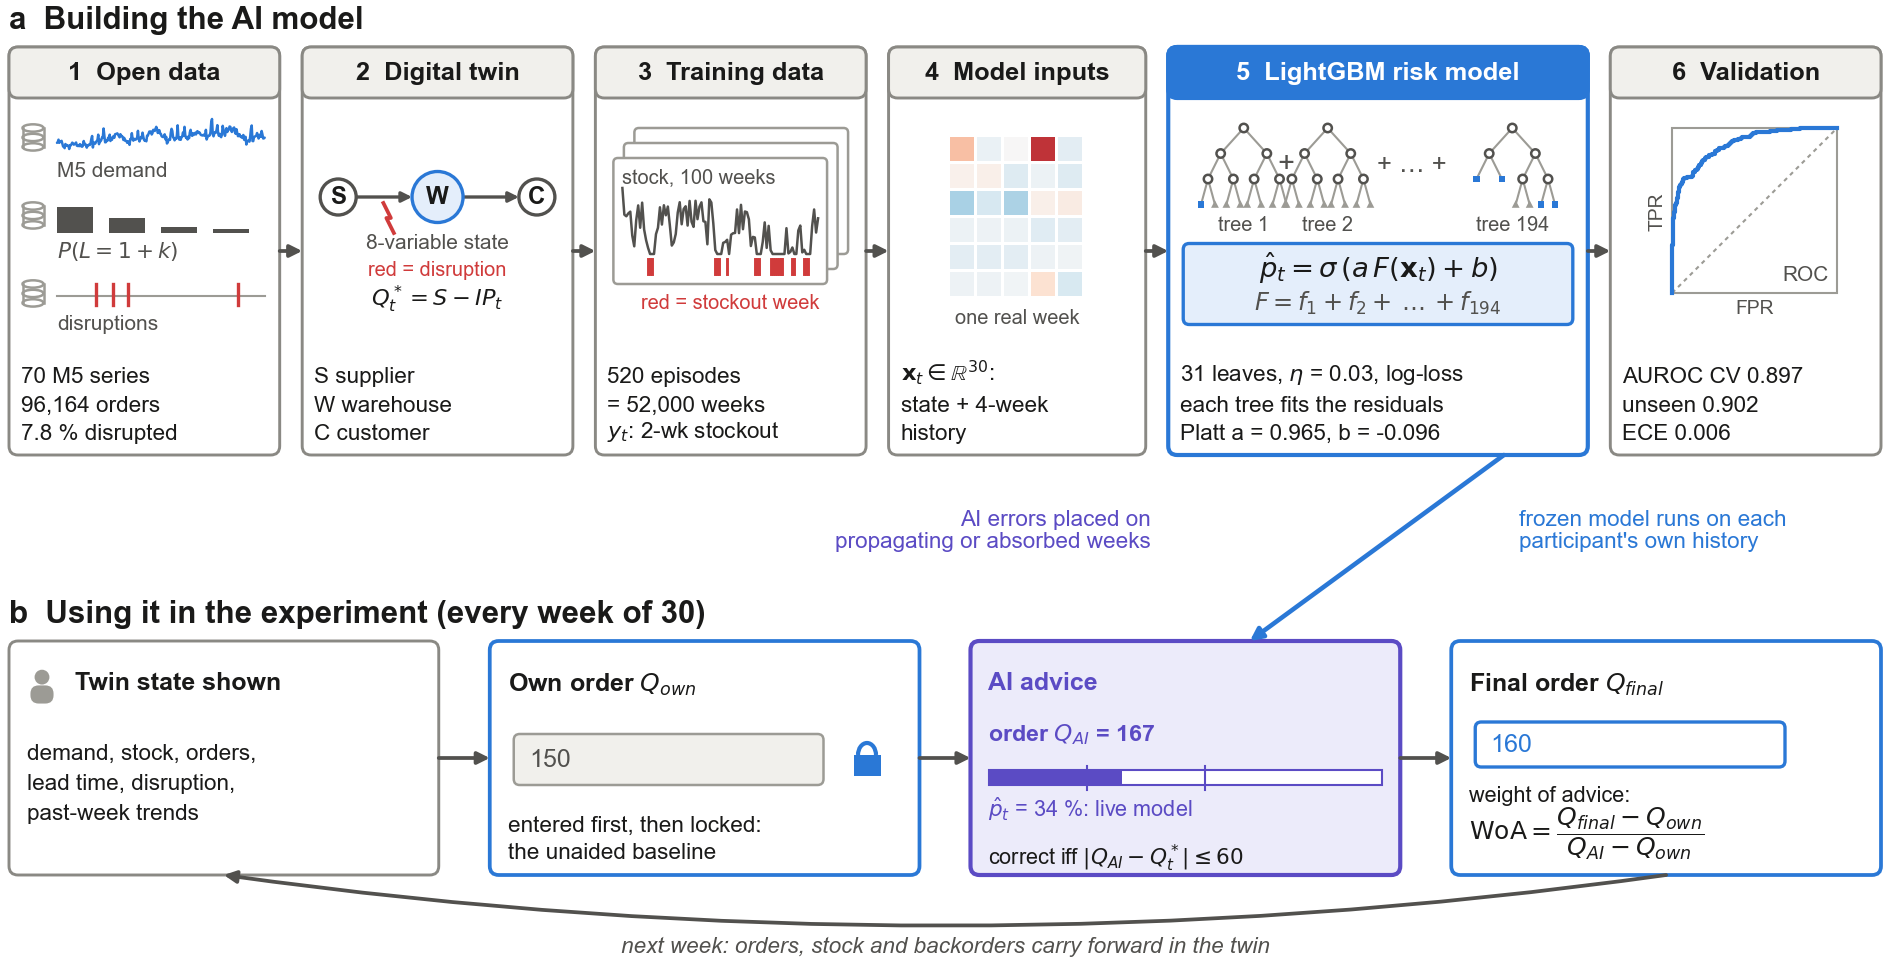
Does trust in AI advice depend on where its errors fall? A 30-week warehouse simulation with a calibrated LightGBM stockout-risk model, deployed as a live study.
0.897model AUROC
30 weekssimulated per participant
PythonLightGBMBehavioural researchRender + Postgres
⚠️ Live research study. Starting a session adds a real response to the study data. Please take part only if you mean to.
Numeracy screener answers
The study opens with three numeracy questions (Schwartz et al., 1997); two of three correct are needed to continue.
- A fair six-sided die is rolled 1,000 times. How many times would it come up even (2, 4 or 6)? 500
- A lottery prize has a 1% chance of winning. If 1,000 people each buy one ticket, how many win? 10
- A sweepstakes car has a 1 in 1,000 chance of winning. What percent of tickets win? 0.1 (type 0.1, meaning 0.1%)
 7 interactive models