โ† All projects
Managerial Decision Making ยท Project Portfolio

๐Ÿงฎ Turning business questions into decisions

Seven interactive models covering the full analyst toolkit: describe the data, find relationships, fit regressions, optimise plans, and decide under uncertainty. Each one runs on the real datasets and re-solves live as you change the inputs.

๐Ÿ“Š Describeโ†’๐Ÿ”— Relateโ†’ ๐Ÿ“ˆ Modelโ†’๐Ÿญ Optimiseโ†’๐ŸŽฒ Decide
Interactive models
7
Real datasets
11
up to 14,059 rows
Solver answers reproduced
13 / 13
by the in-browser engine
Tools
Excel ยท Solver
plus Python and JavaScript
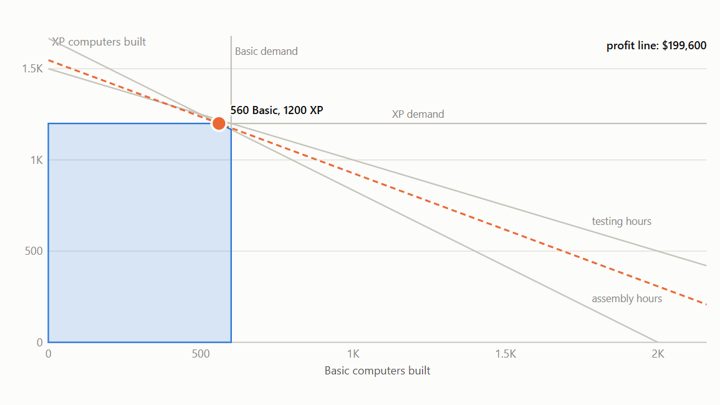
Feasible region with optimal production plan

๐Ÿญ Product Mix Optimizer

How many of each computer to build under labour and demand limits, plus an 8-model plan and a 6-month production schedule.

Optimum: 560 Basic + 1,200 XP = $199,600; one more assembly hour is worth $16
Linear programmingShadow pricesExcel Solver
โ–ถ Interactive model
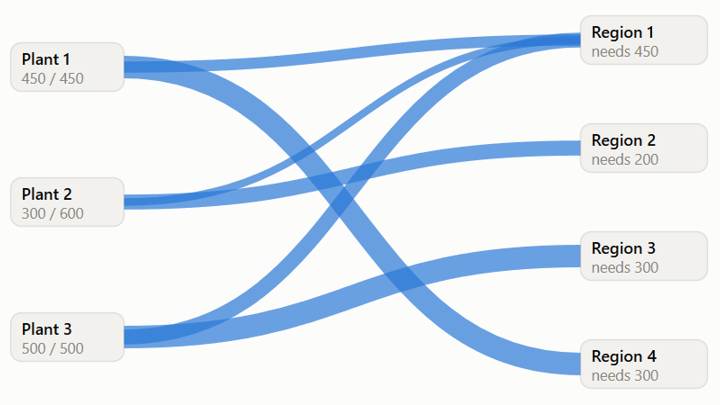
Shipping network from plants to regions

๐Ÿšš Operations Optimizer

Staff scheduling with whole-number workers, a plant-to-region shipping network, and a five-year investment plan.

23 workers cover the week ยท shipping $176,050 ยท $100K grows to $286,792
Integer programmingTransportationCash-flow planning
โ–ถ Interactive model
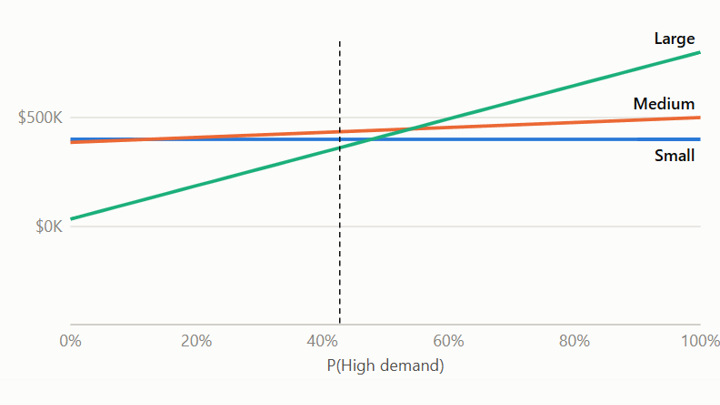
EMV sensitivity to demand probability

๐ŸŽฒ Decision Lab

A developer picks a project size before demand is known. Five decision rules, the value of a market forecast, and risk aversion.

EMV picks Medium ($434.75K); the forecast is worth $120.25K; a risk-averse owner picks Small
Decision analysisBayes' ruleUtility
โ–ถ Interactive model
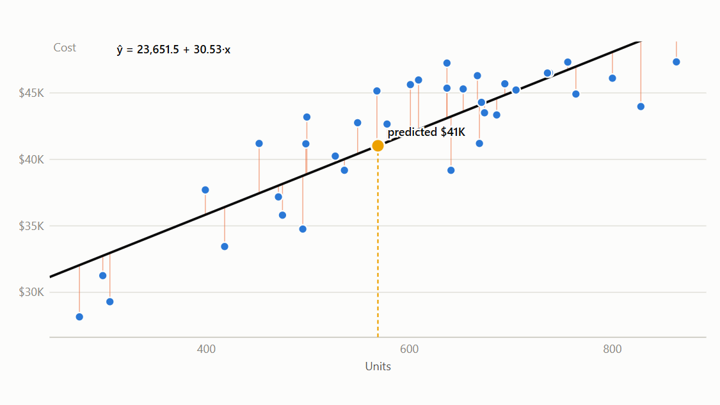
Scatter plot with least-squares line

๐Ÿ“ˆ Regression Lab

Four business datasets with animated least-squares fits, predictions, multiple regression and confidence intervals.

Power cost: Rยฒ = 0.736, $30.53 per extra unit ยท truck age is not a significant cost driver
RegressionInferenceConfidence intervals
โ–ถ Interactive model
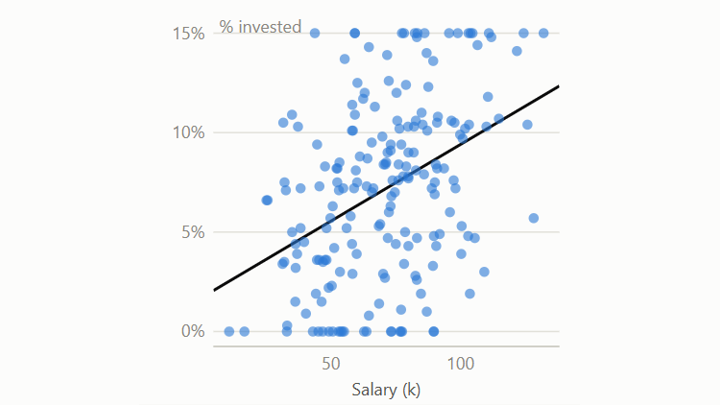
Standardised effect of each predictor

๐Ÿ’ผ Retirement Savings Case

What predicts the share of income 194 couples invest for retirement? Toggle predictors and the model refits live.

Salary raises saving, mortgage and debt lower it; children don't matter (p = 0.954)
Multiple regressionModel selectionTeam project
โ–ถ Interactive model
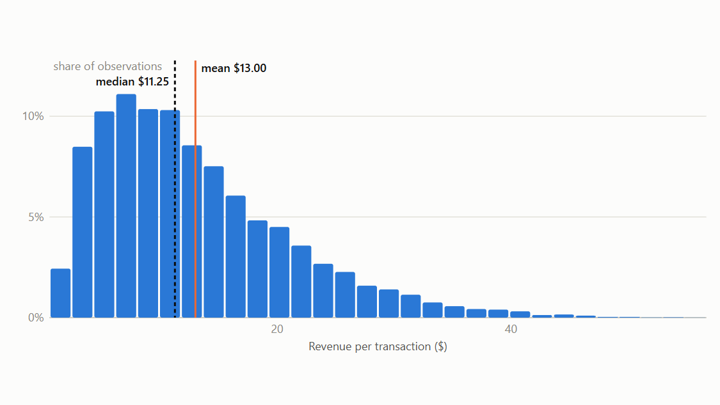
Histogram of supermarket revenue

๐Ÿ“Š Distribution Explorer

Histograms, box plots and summary statistics for 14,059 supermarket transactions, 379 metro commutes and survey salaries.

Revenue per transaction: mean $13.00 vs median $11.25, a long right tail
Descriptive statisticsHistogramsSkewness
โ–ถ Interactive model
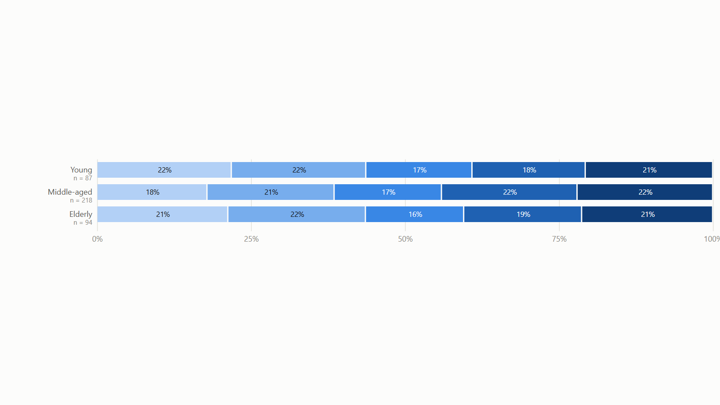
Opinion mix by age group

๐Ÿ”— Relationship Explorer

Cross-tabulations of survey opinion by group and a clickable correlation grid of employee salary data.

Salary tracks experience at the firm (r = 0.67) more than education (r = 0.54)
Pivot tablesCrosstabsCorrelation
โ–ถ Interactive model

Verified against Excel Solver

The models run a simplex / branch-and-bound engine and a least-squares engine written in JavaScript. At the original inputs they reproduce every answer from the Excel workbooks:
ModelExcel answerIn-browser engine
Two-product mix: maximum profit$199,600$199,600 โœ“
Eight-model mix: maximum profit$615,812.50$615,812.50 โœ“
Six-month production plan: minimum cost$1,535,562.50$1,535,562.50 โœ“
Shipping plan: minimum cost$176,050$176,050 โœ“
Five-year investing: final cash$286,791.96$286,791.96 โœ“
Staff scheduling: fewest workers2323 โœ“
Retirement regression: Rยฒ / F0.4531 / 52.470.4531 / 52.47 โœ“