💰 Hospital Profit Simulator
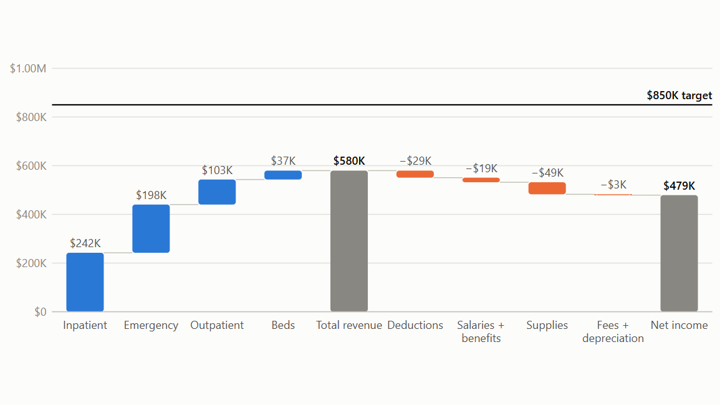
An Excel decision-support model of hospital profit across five states. Ohio misses its target, so three plans are built to close the gap.
Seven projects on public-health and hospital data from the CDC, NCHS, California's HCAI and SAS. Each starts from a raw dataset, is cleaned and analysed in Tableau, SAS Viya or Excel, checked number by number against the source, and ends in a model you can play with.
An Excel decision-support model of hospital profit across five states. Ohio misses its target, so three plans are built to close the gap.
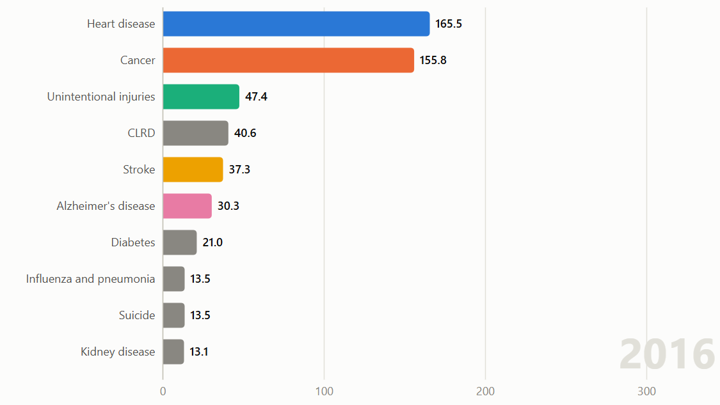
Ten leading causes re-rank year by year for the U.S. or any state, by age-adjusted rate or by deaths.
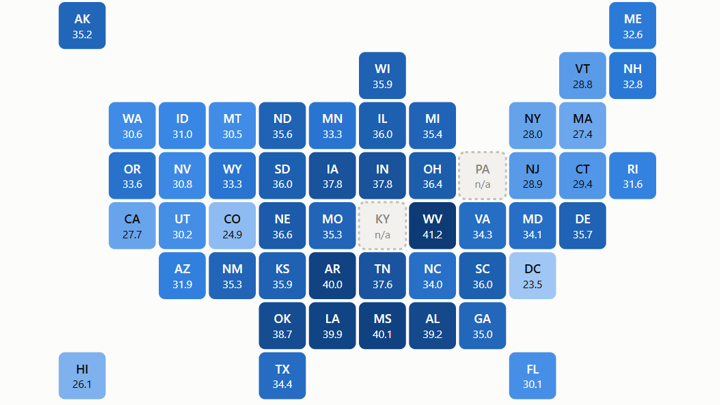
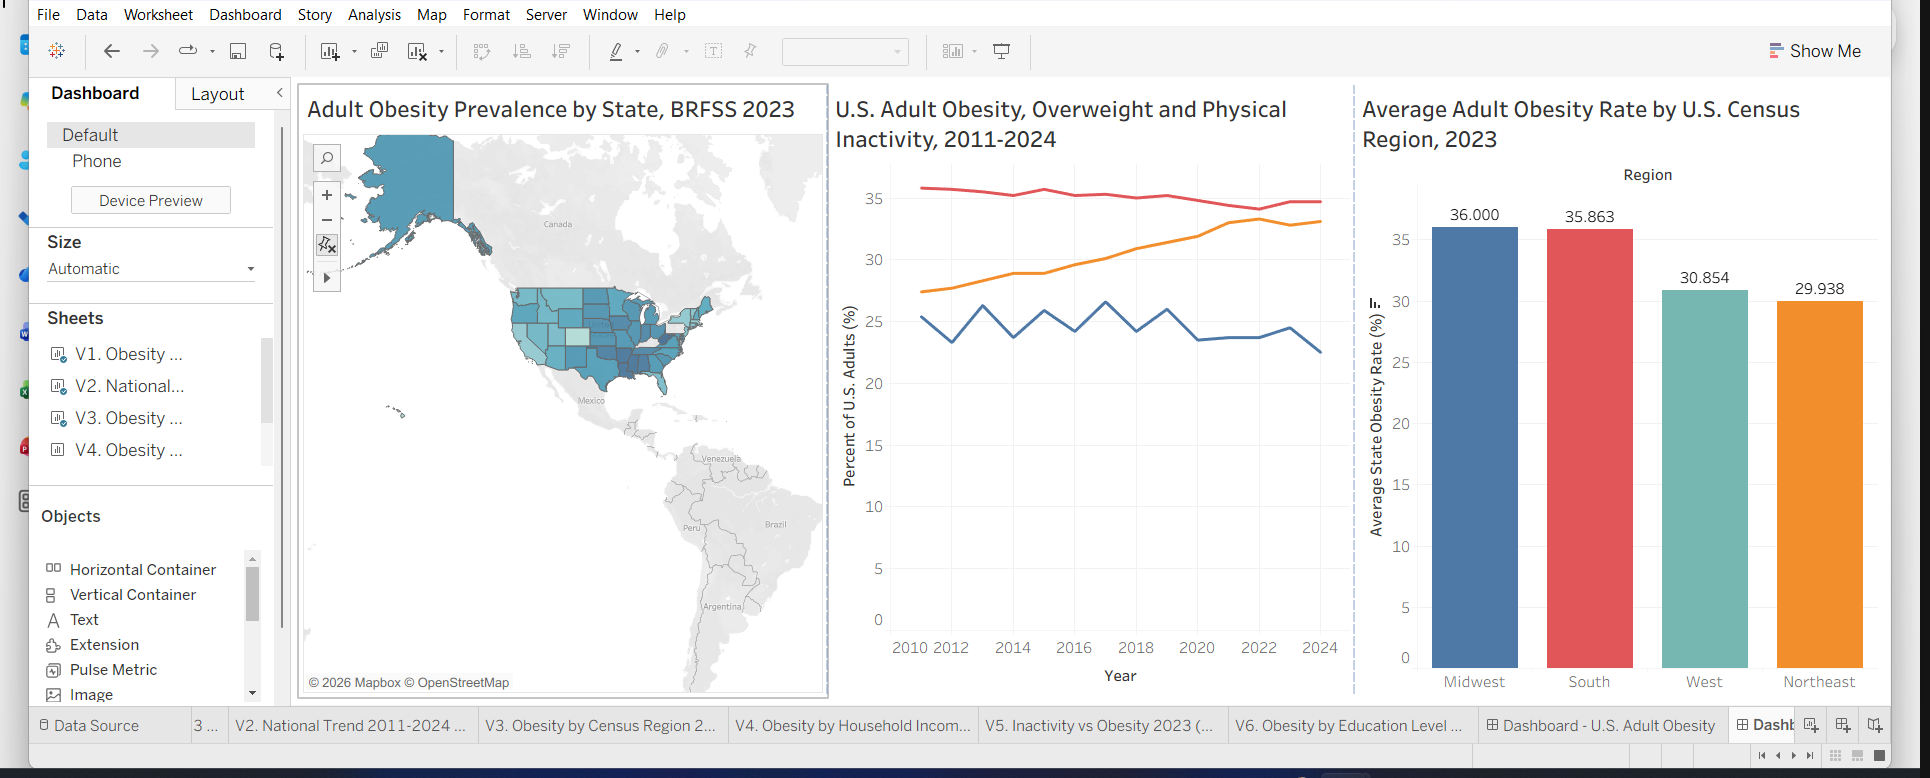
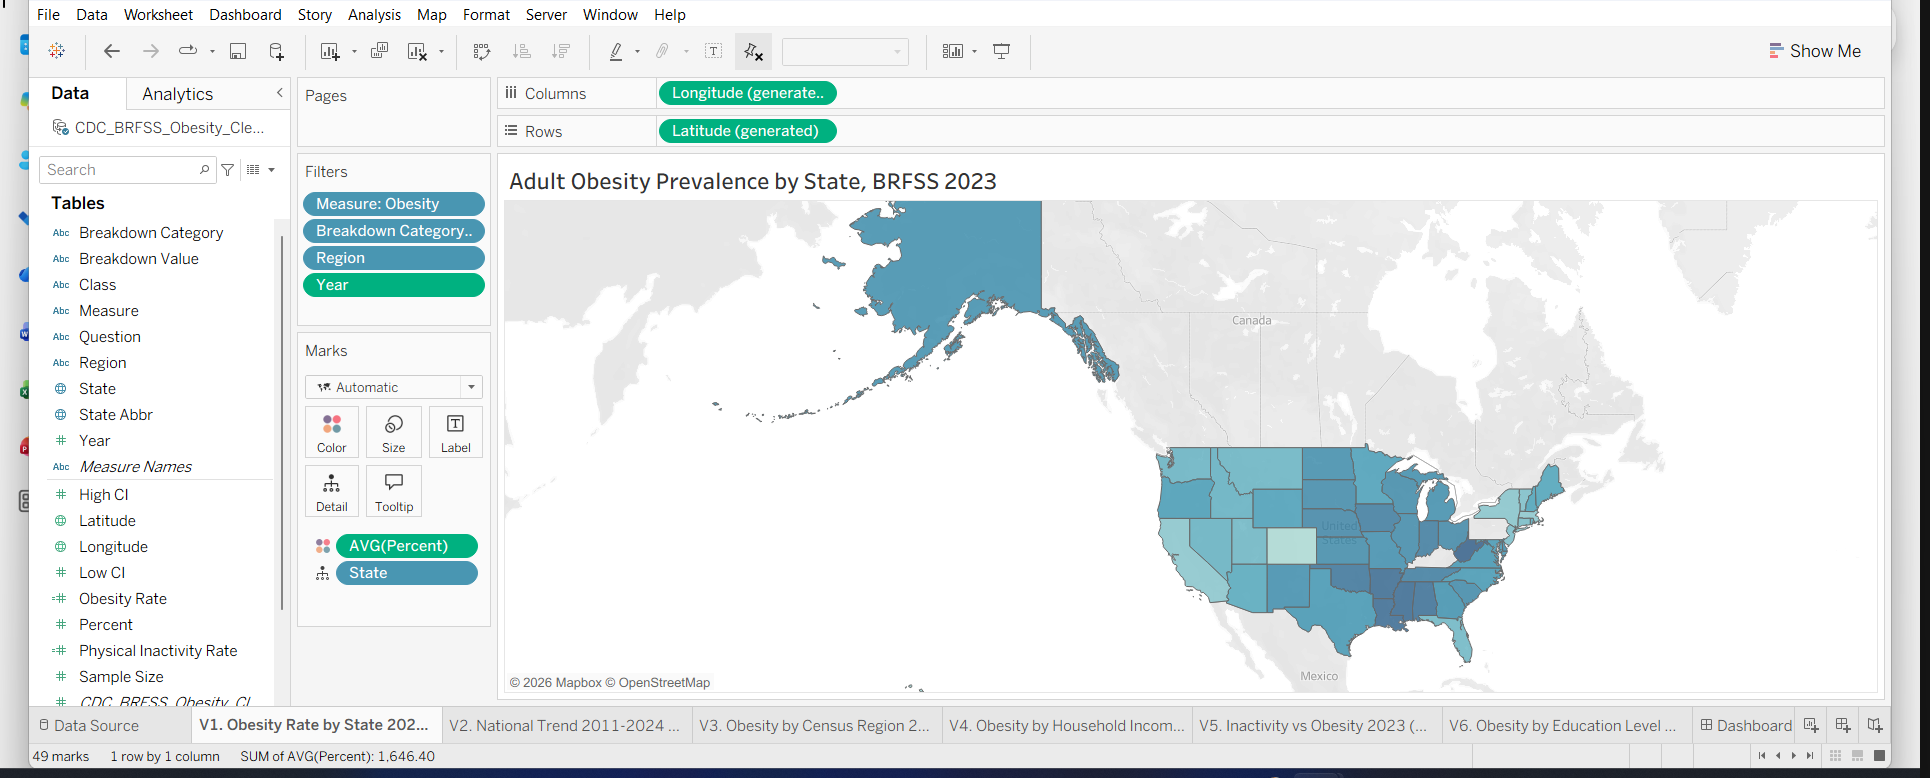
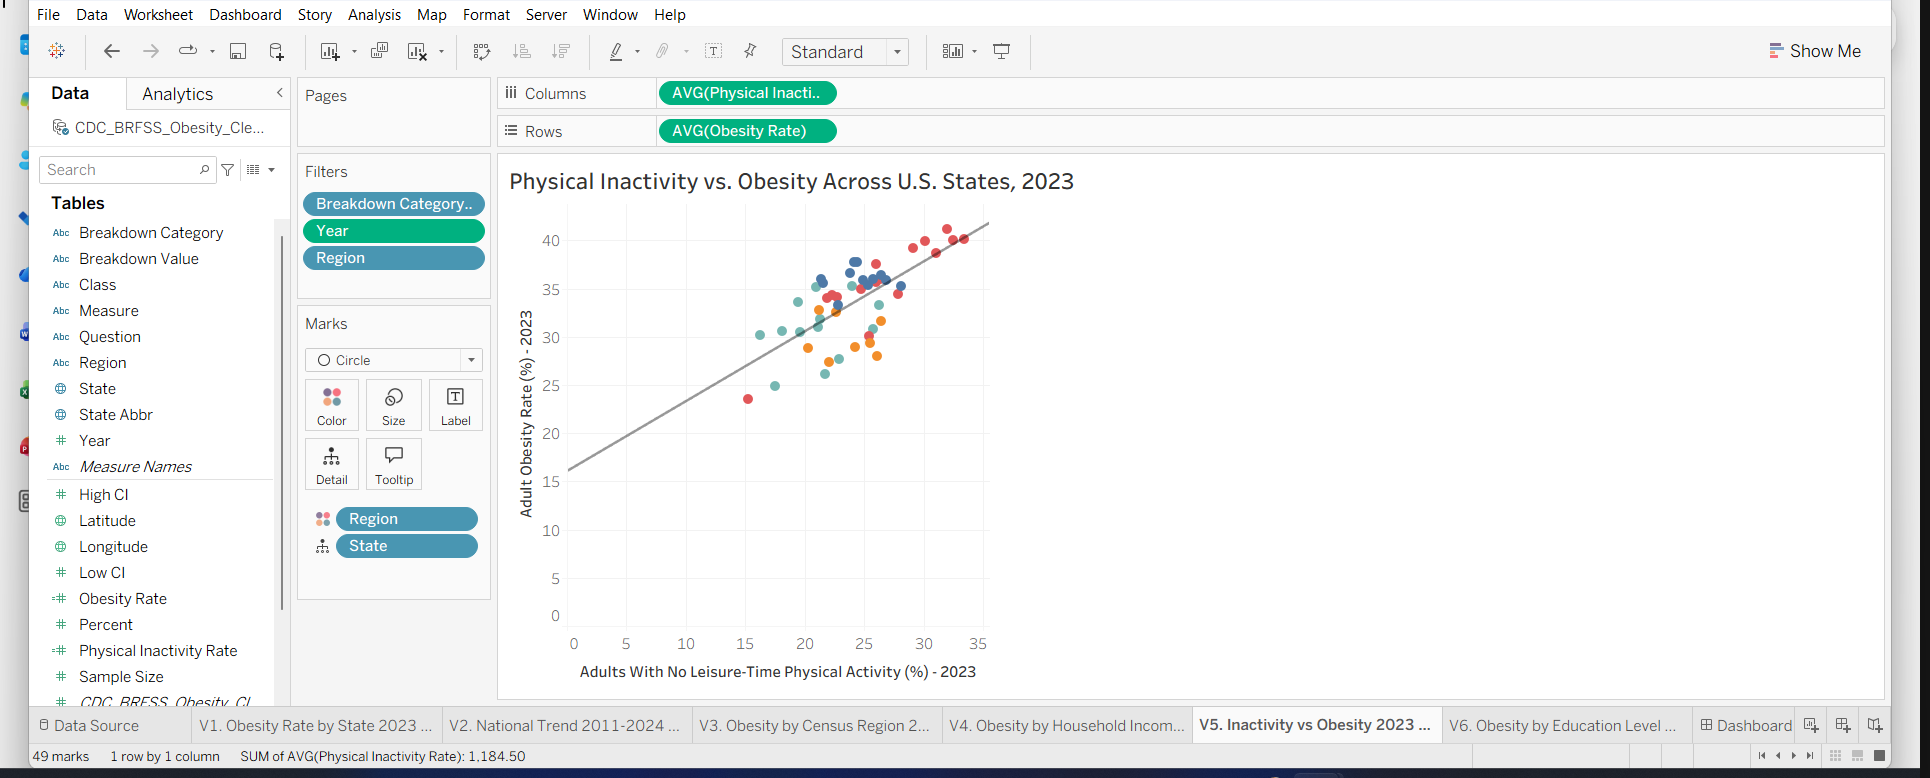
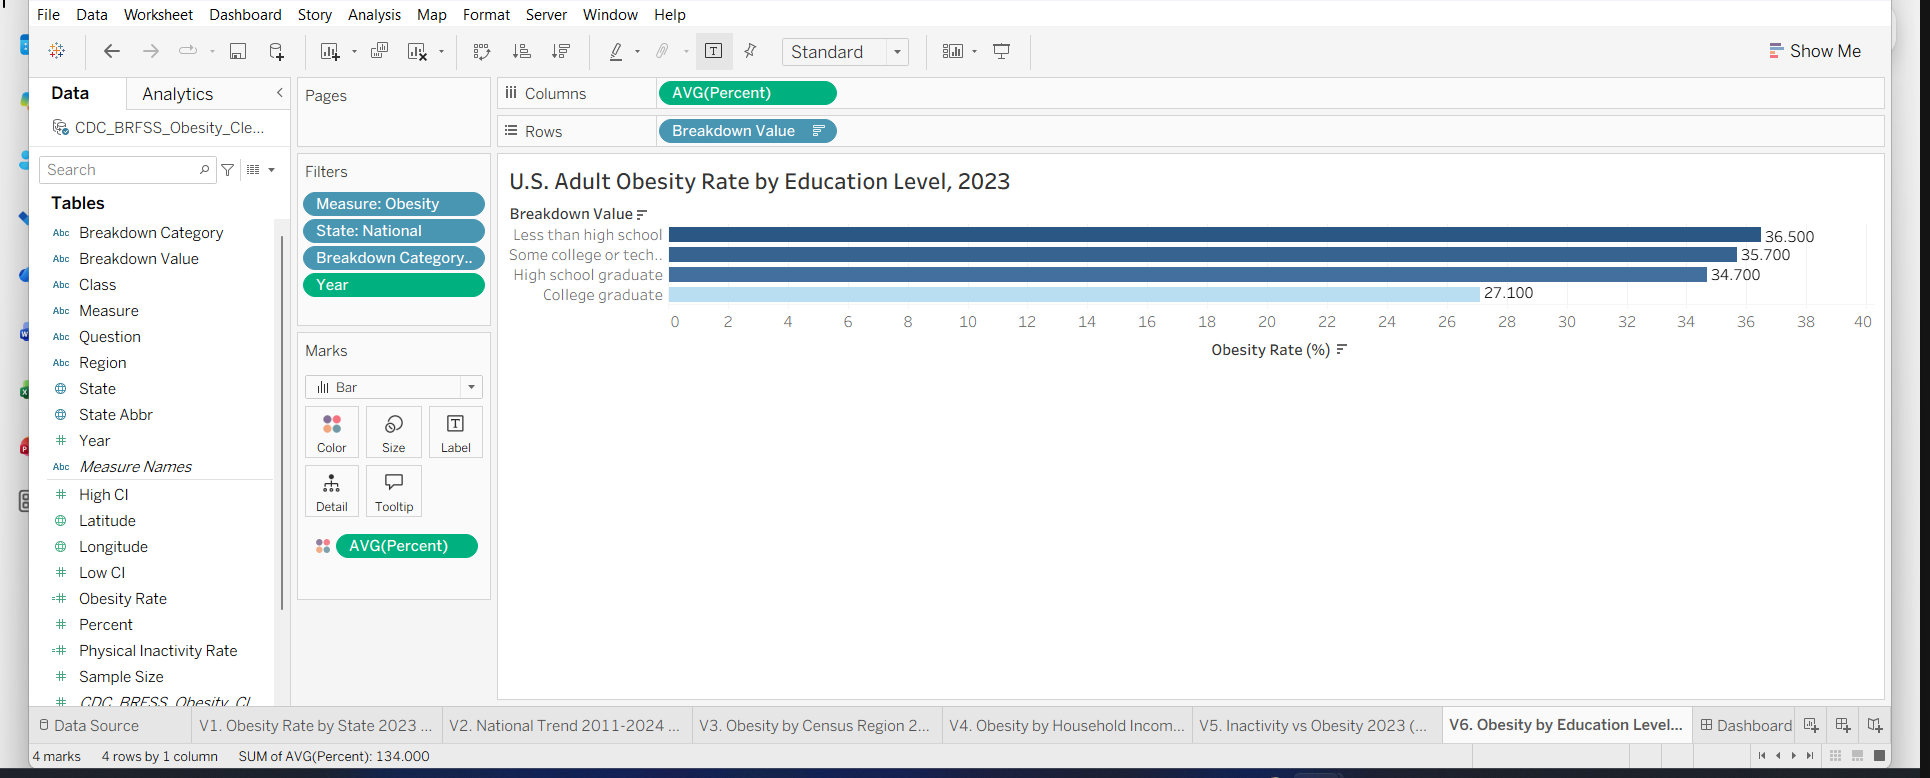
Hypothesis-driven analysis of a 110,880-row CDC survey: an animated state map, inactivity vs obesity, and the national trend.
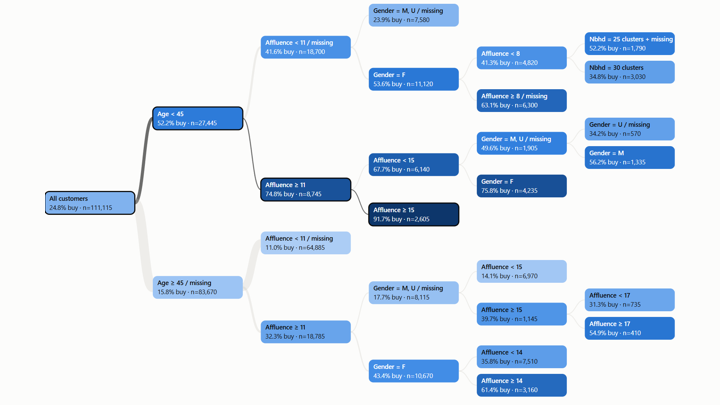
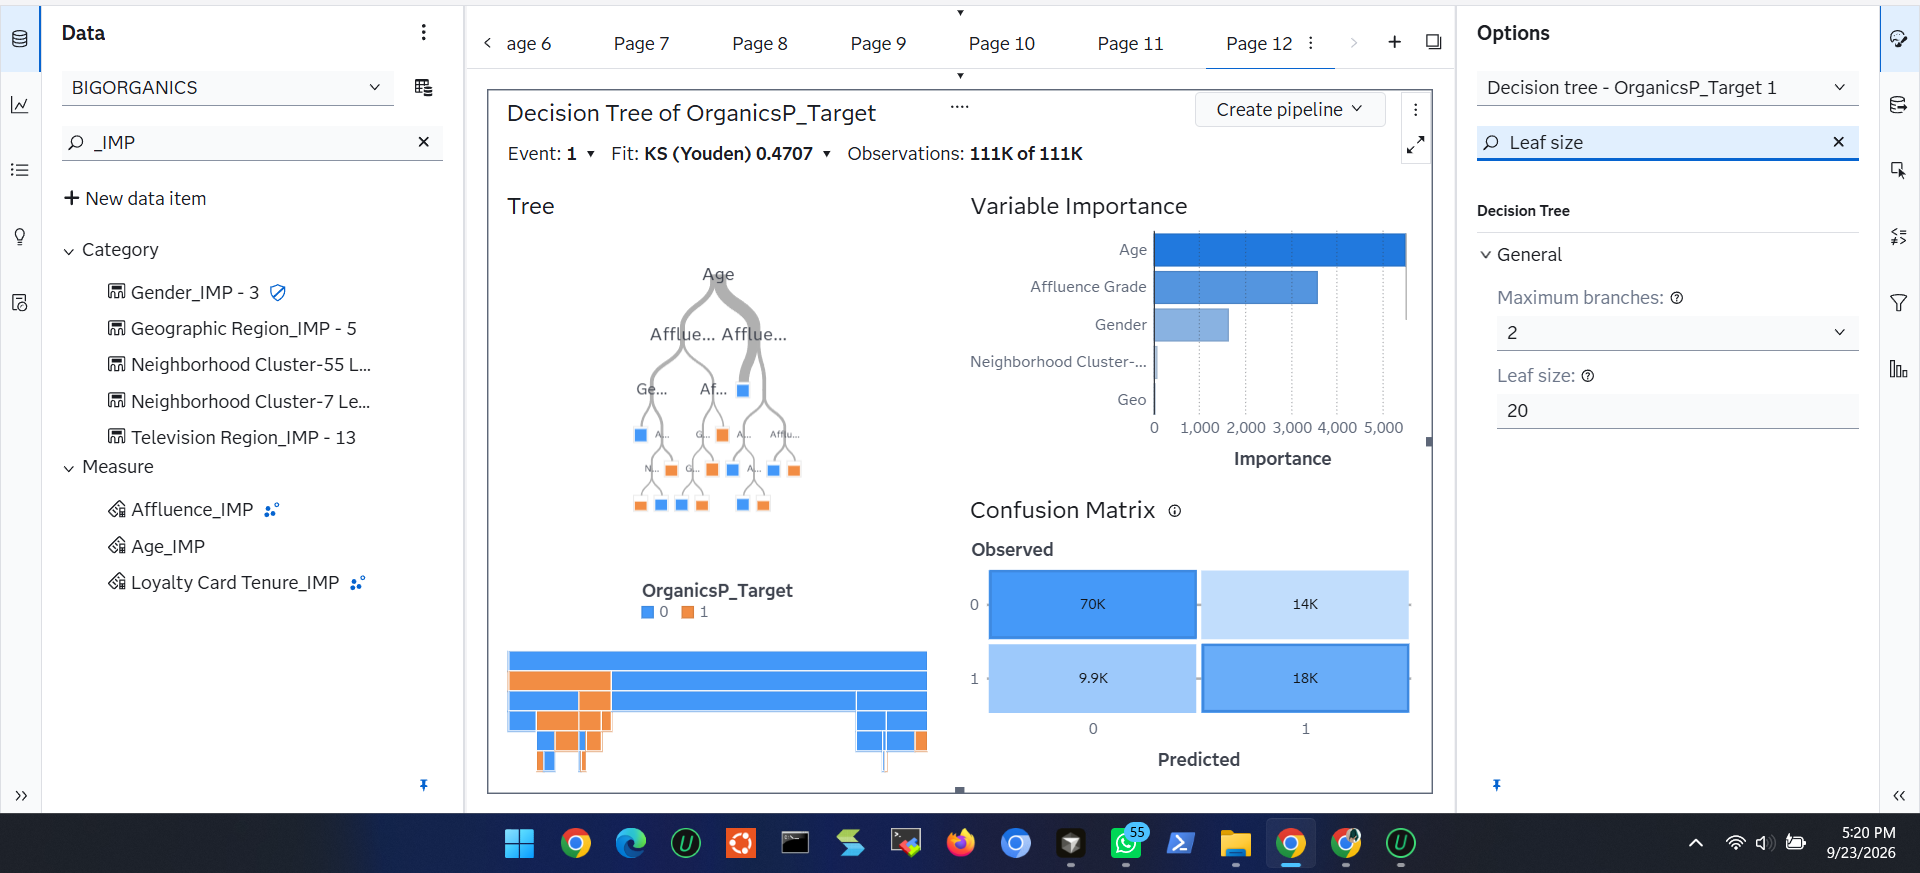
The real SAS decision tree on 111,115 loyalty customers, with shoppers flowing through it and a customer builder.
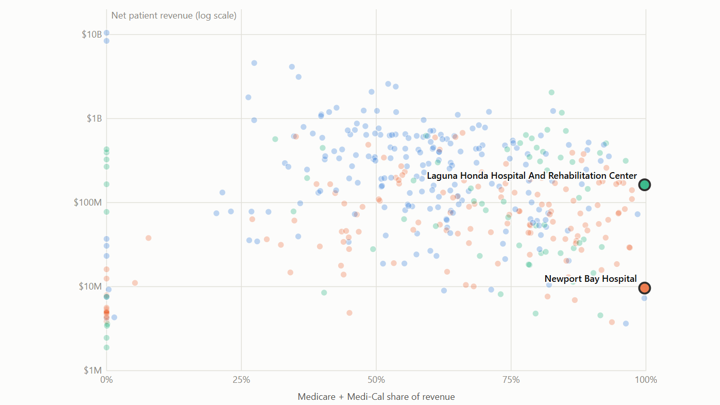
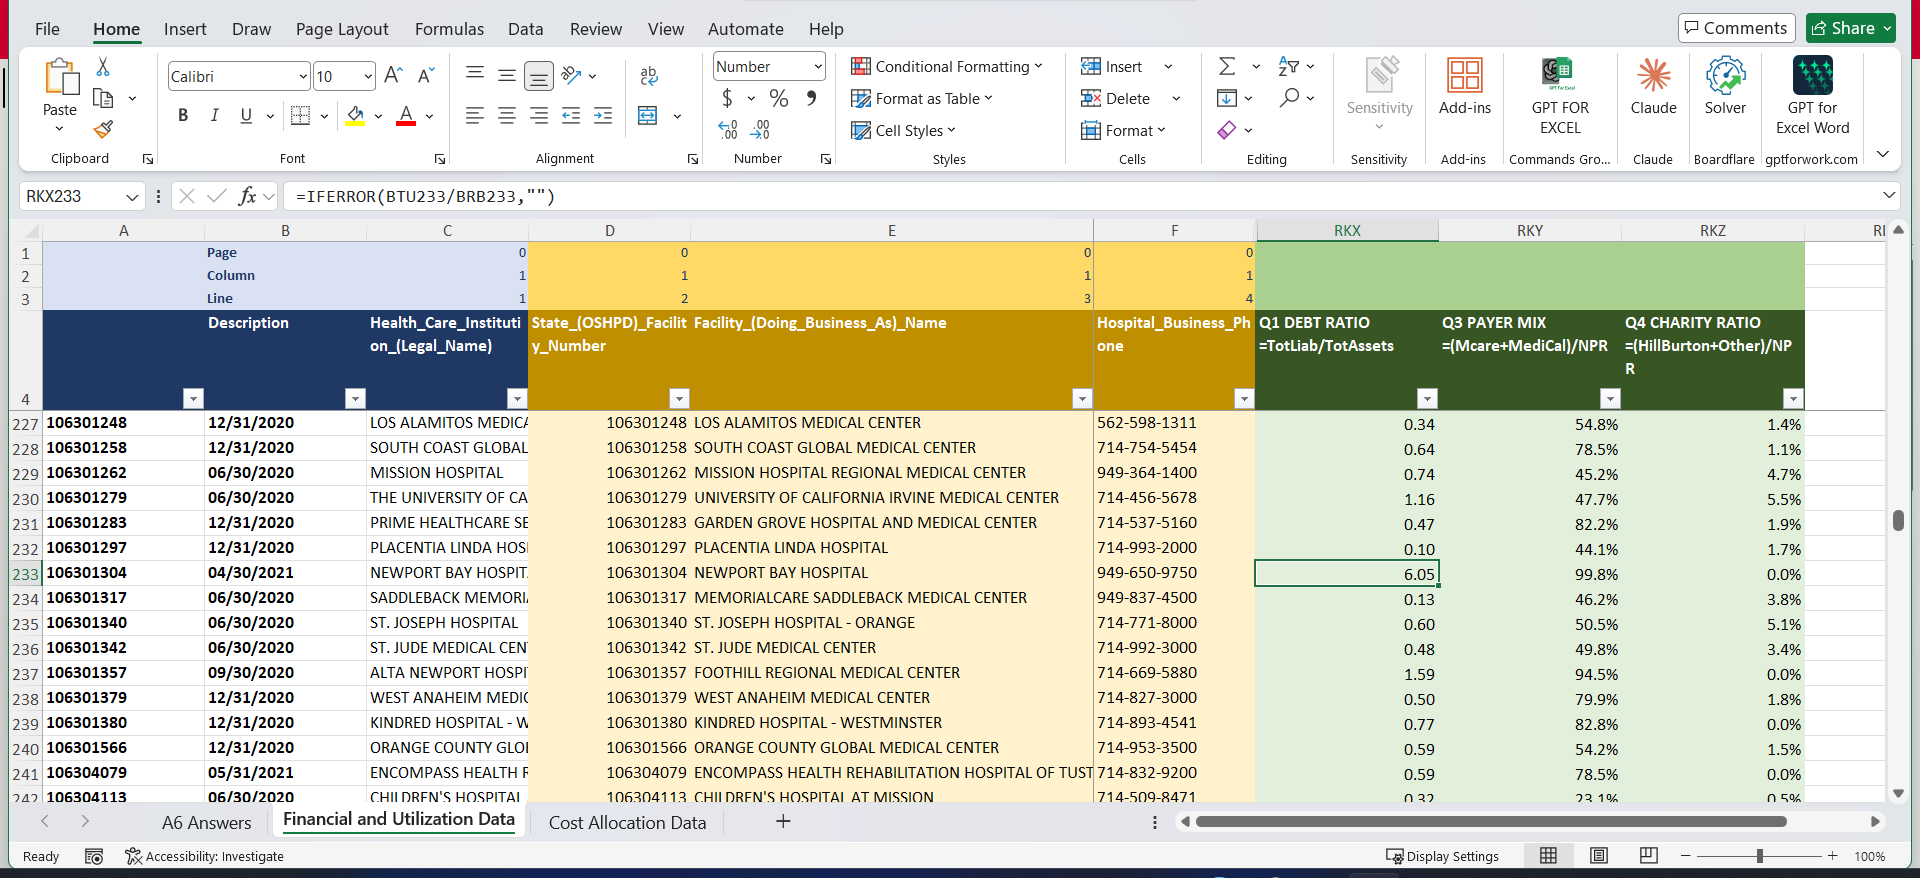
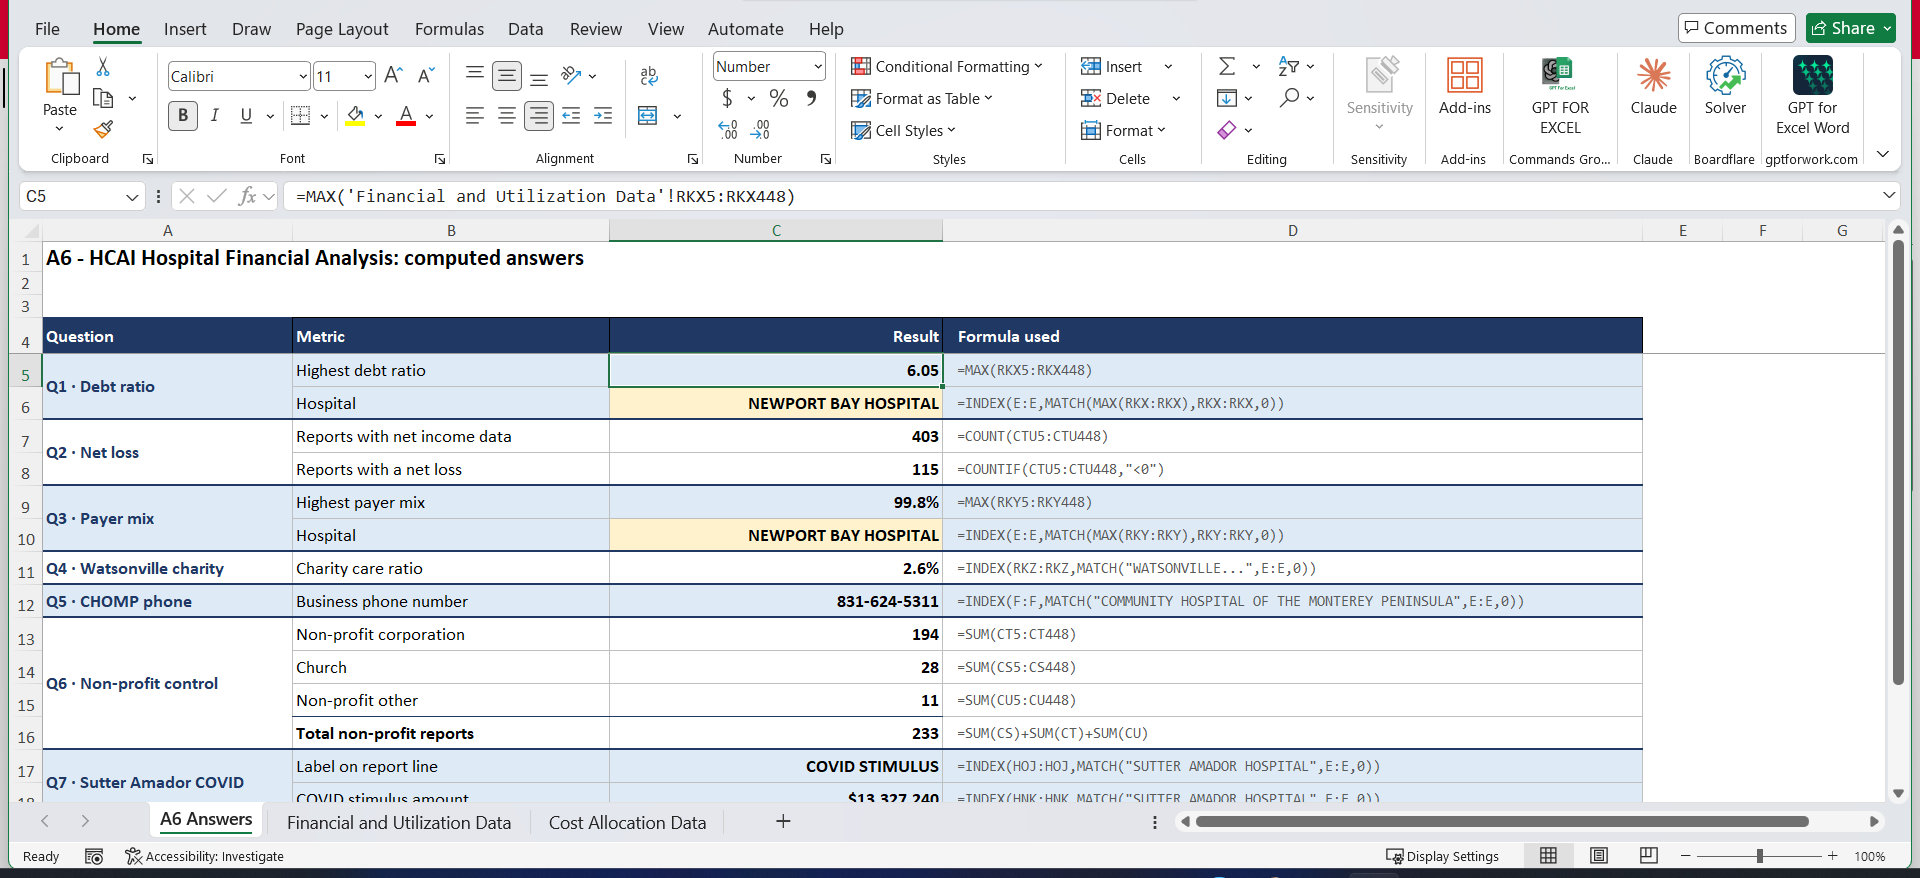
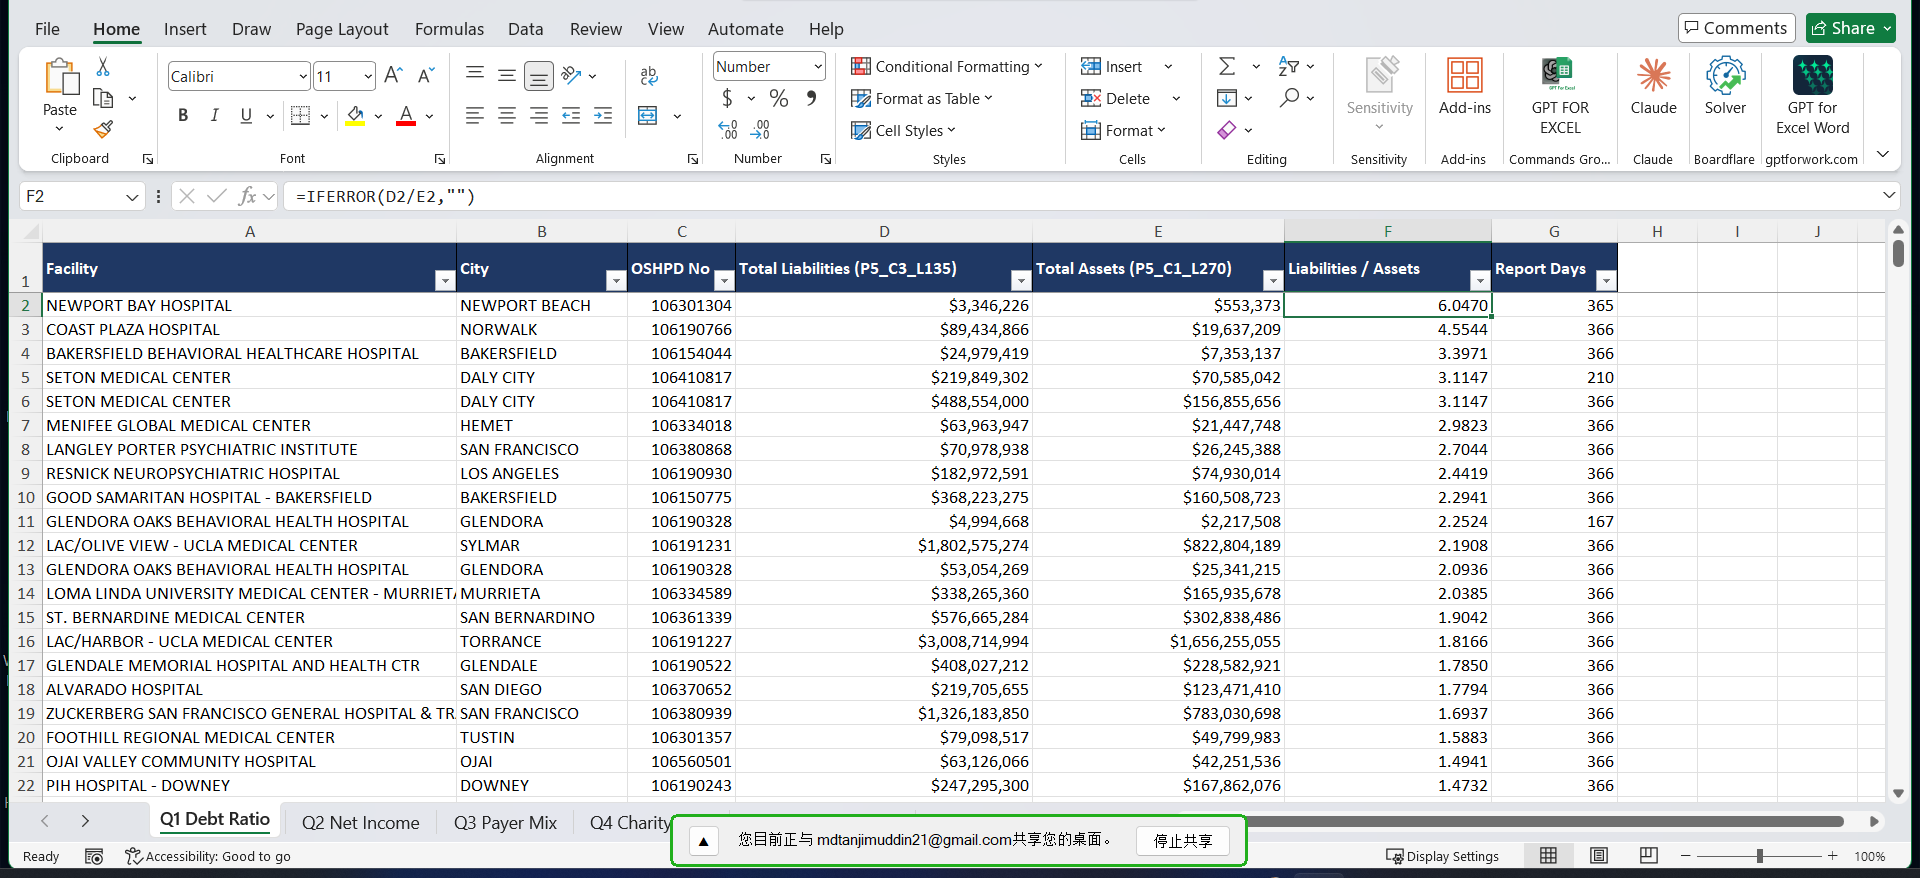
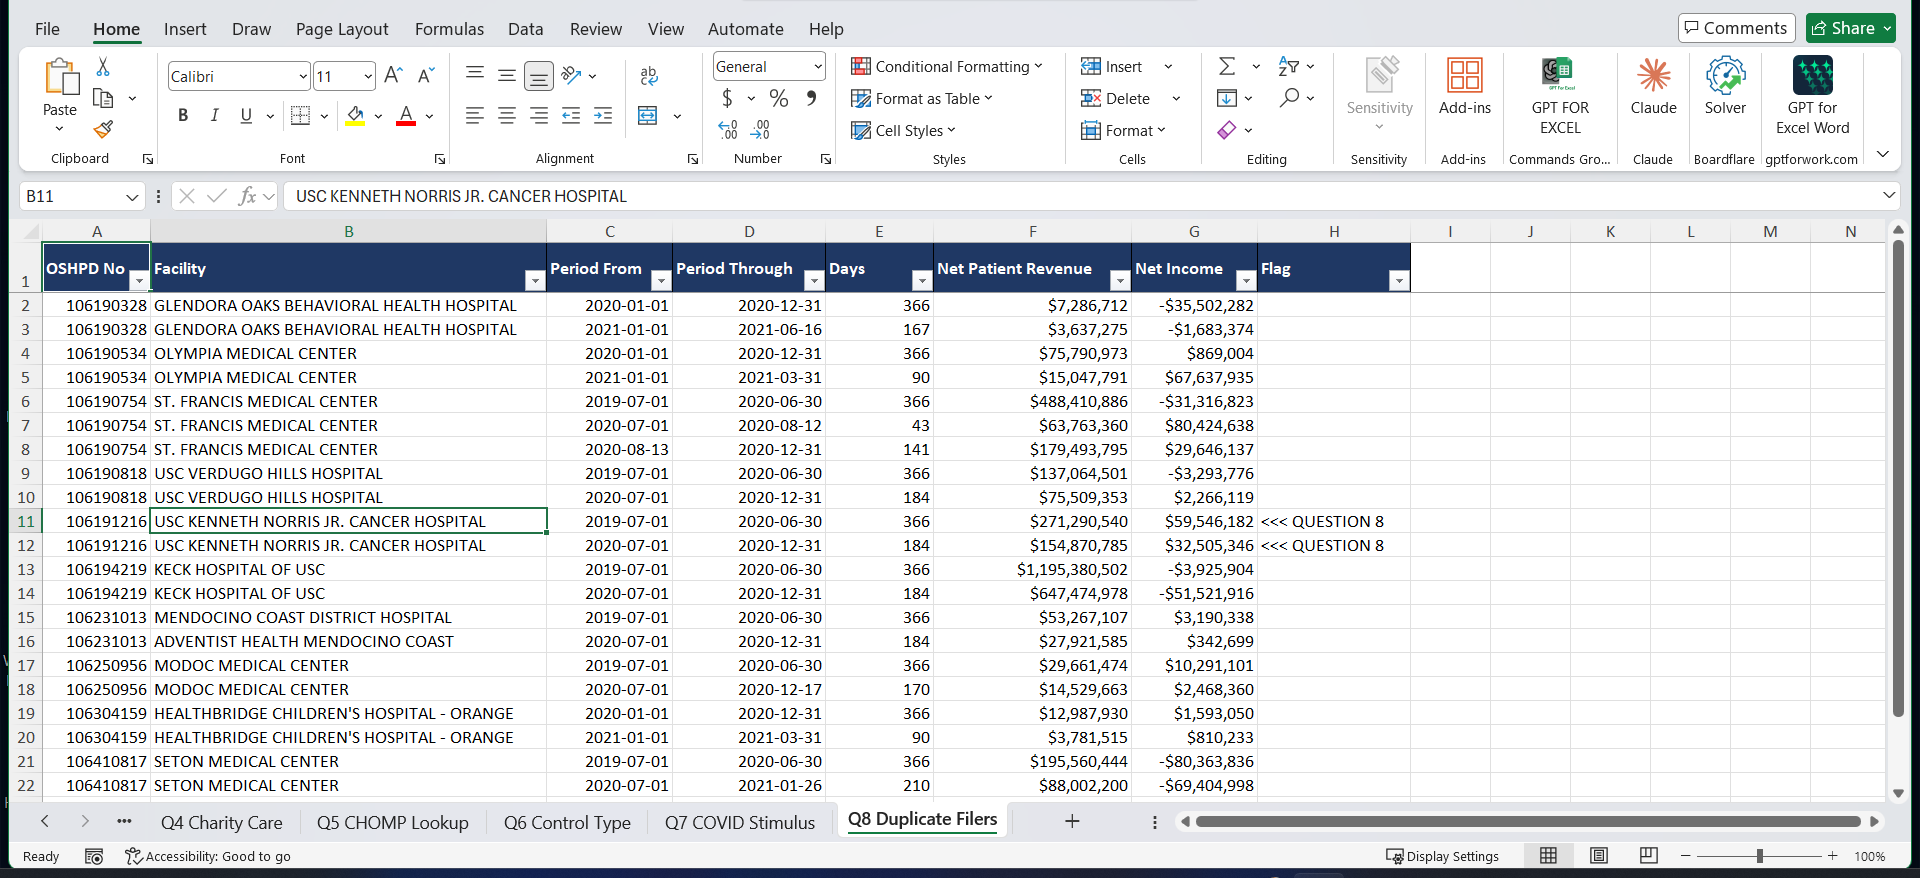
California hospital finances with a guided tour of executive questions and an animation that merges duplicate filings.
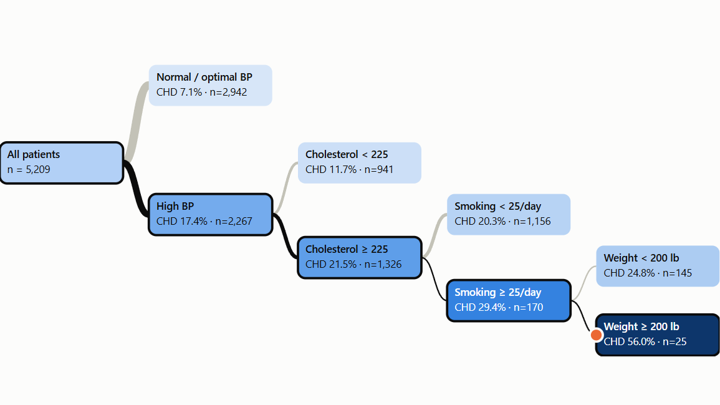
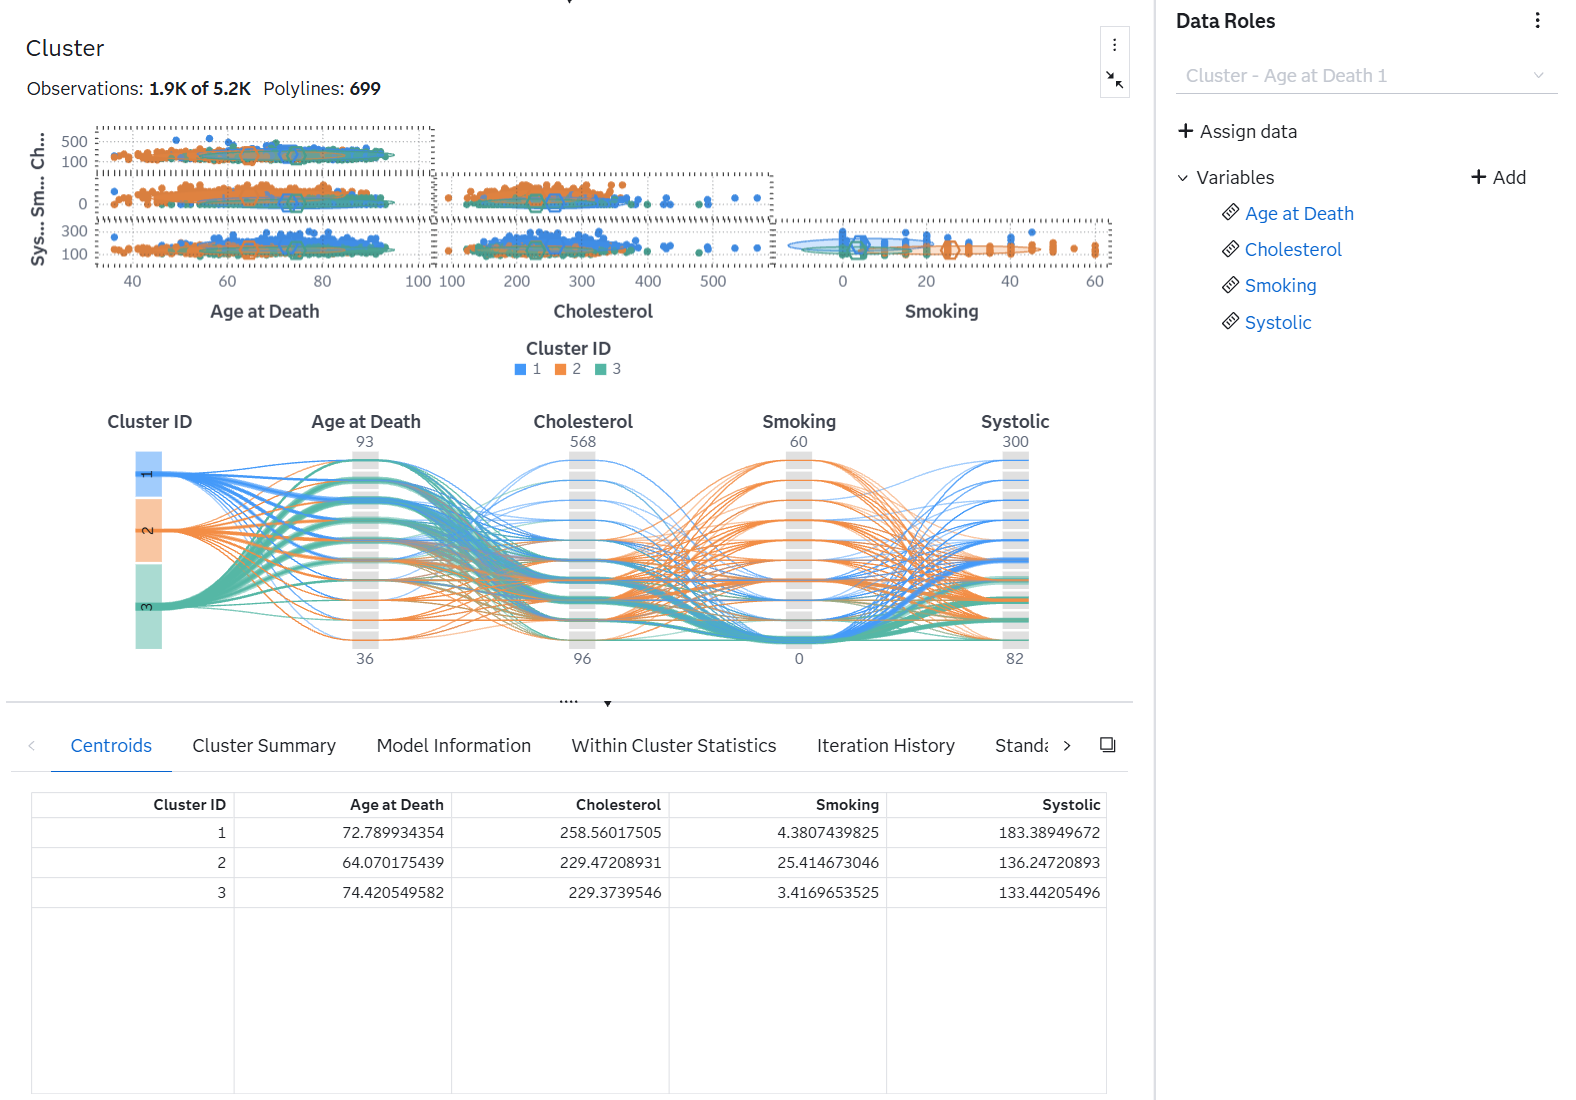
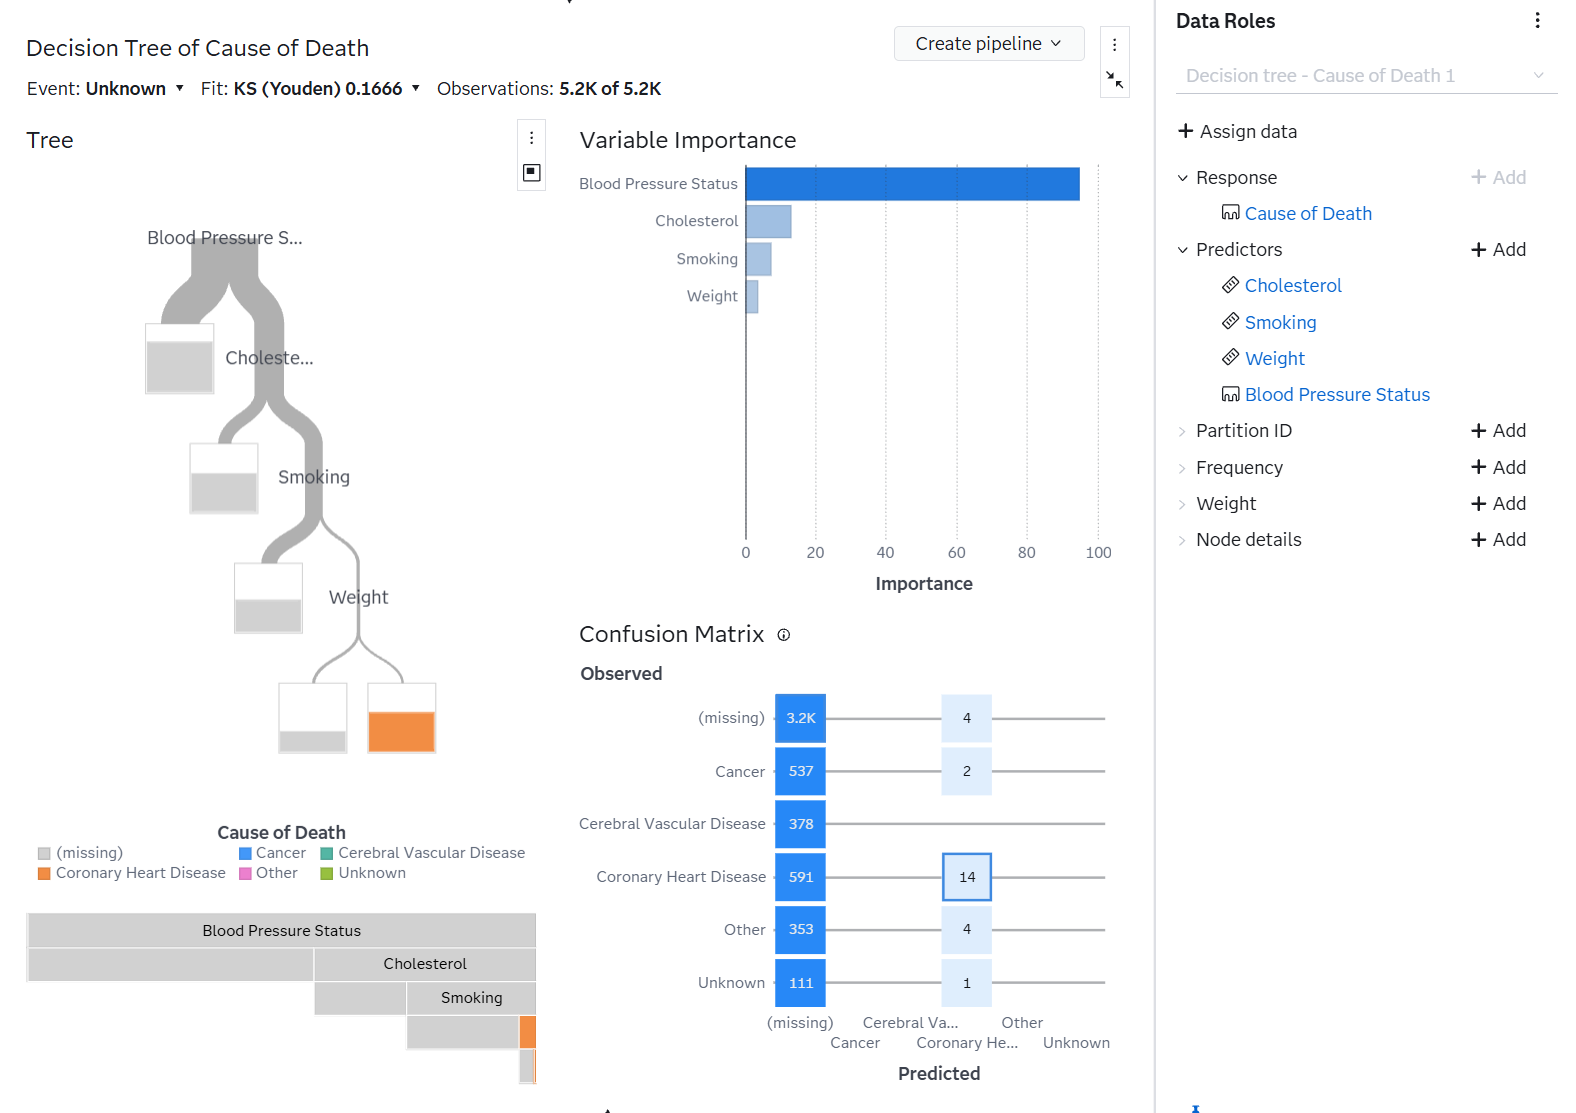
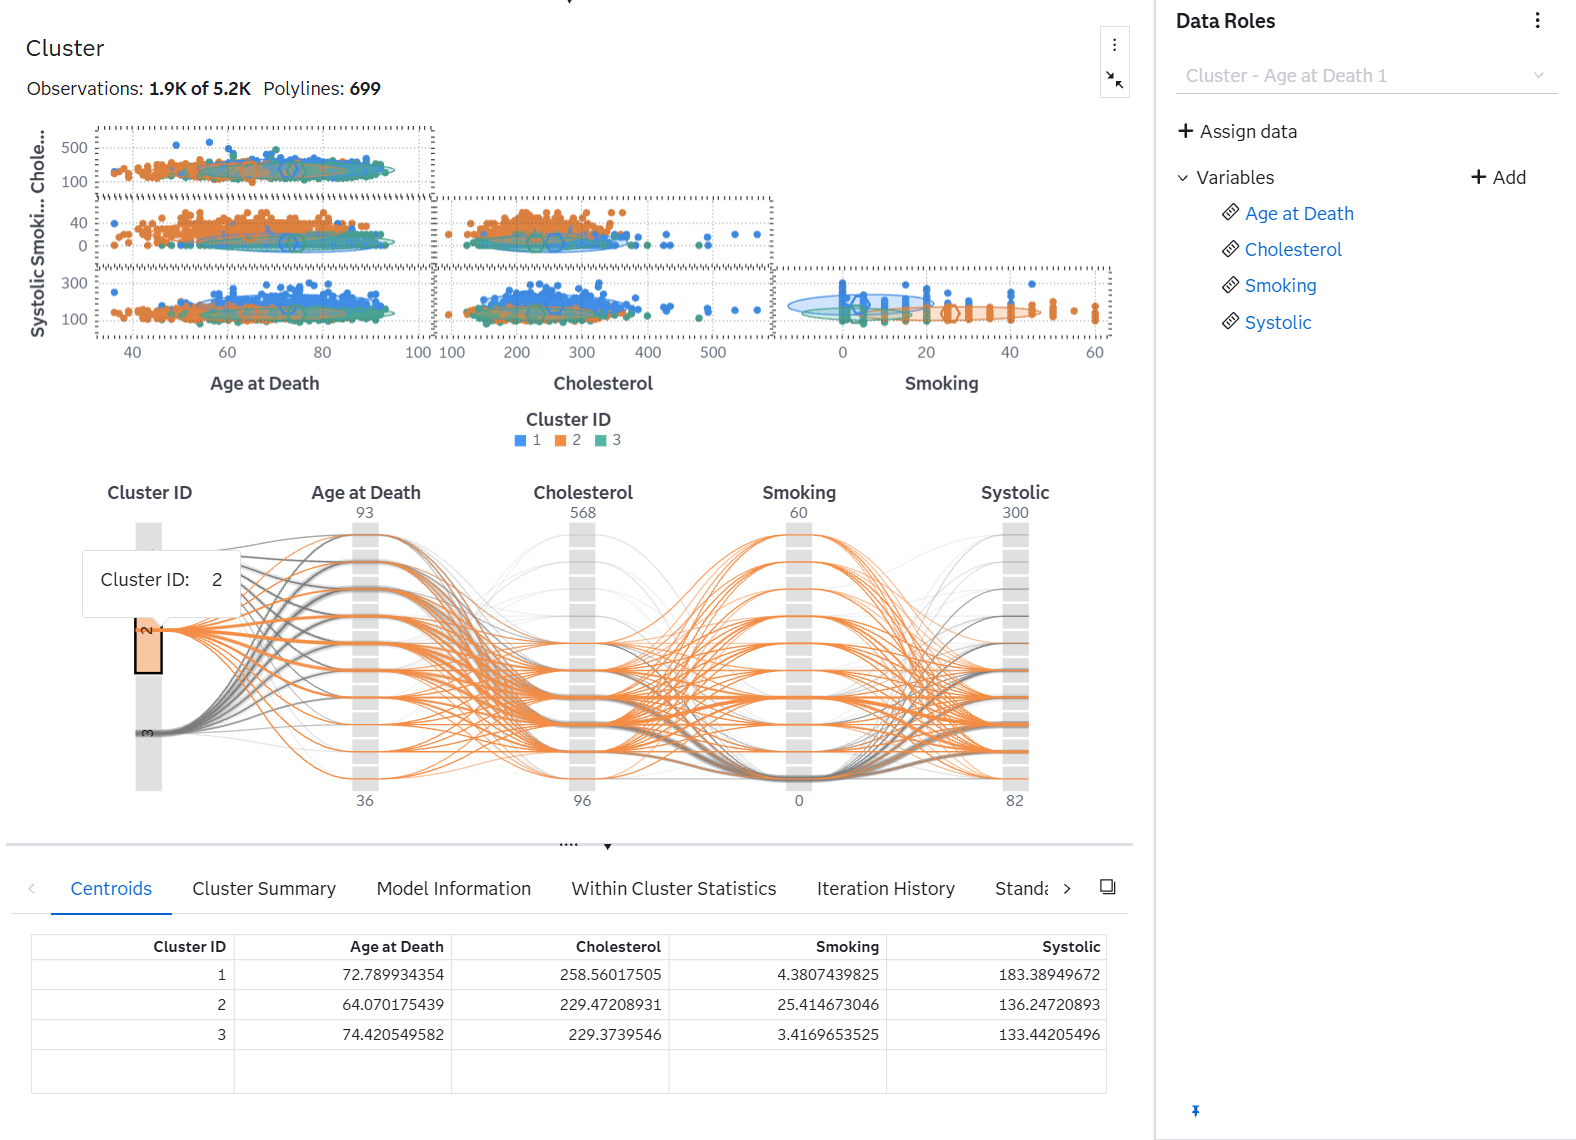
Walk a patient down the risk tree fitted on 5,209 Framingham patients, plus three patient profiles from k-means.
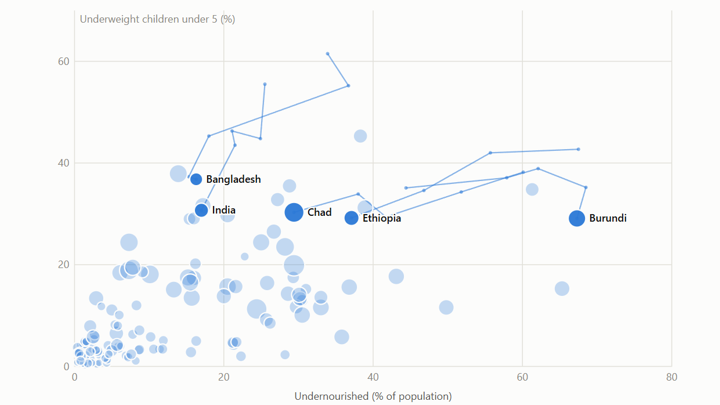
All 130 countries in the Global Hunger Index animated from 1990 to 2014, Gapminder-style.
Every headline number was recomputed from the raw data files, not copied from the reports. A few examples:
| Claim | Source | Recomputed |
|---|---|---|
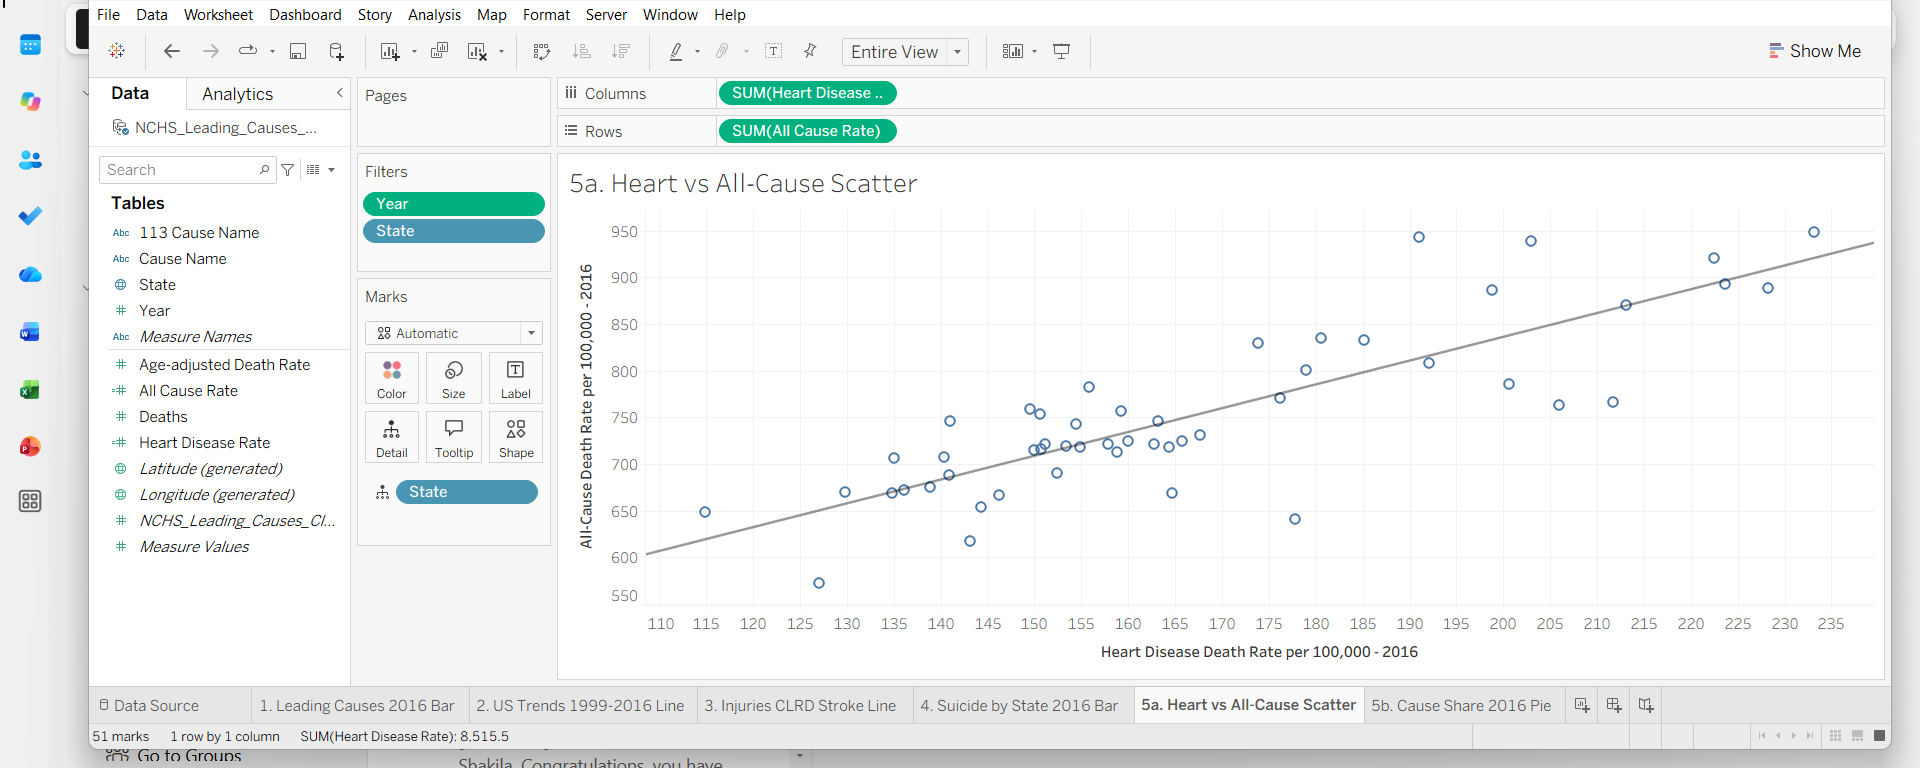
| Heart disease vs all-cause mortality across states | NCHS, 2016 | r = 0.834 ✓ |
| Alzheimer's age-adjusted death rate, 1999 → 2016 | NCHS | +83.6% ✓ |
| Physical inactivity vs obesity across 49 states | CDC BRFSS, 2023 | r = 0.70 ✓ |
| Hospital reports → unique facilities | HCAI disclosure file | 444 → 432 ✓ |
| Best BigOrganics segment buy rate | SAS decision-tree export | 2,390 / 2,605 = 91.7% ✓ |
| Ohio Plan B net income | Excel DSS model | $959,145.04 ✓ |
The charts and screenshots behind each project. Hover any chart for exact values.
An Excel model of hospital revenue, expenses and net income for five states. Ohio fell far short of an $850K net-income target, so three scenarios were built to close the gap. Every number is a live formula.
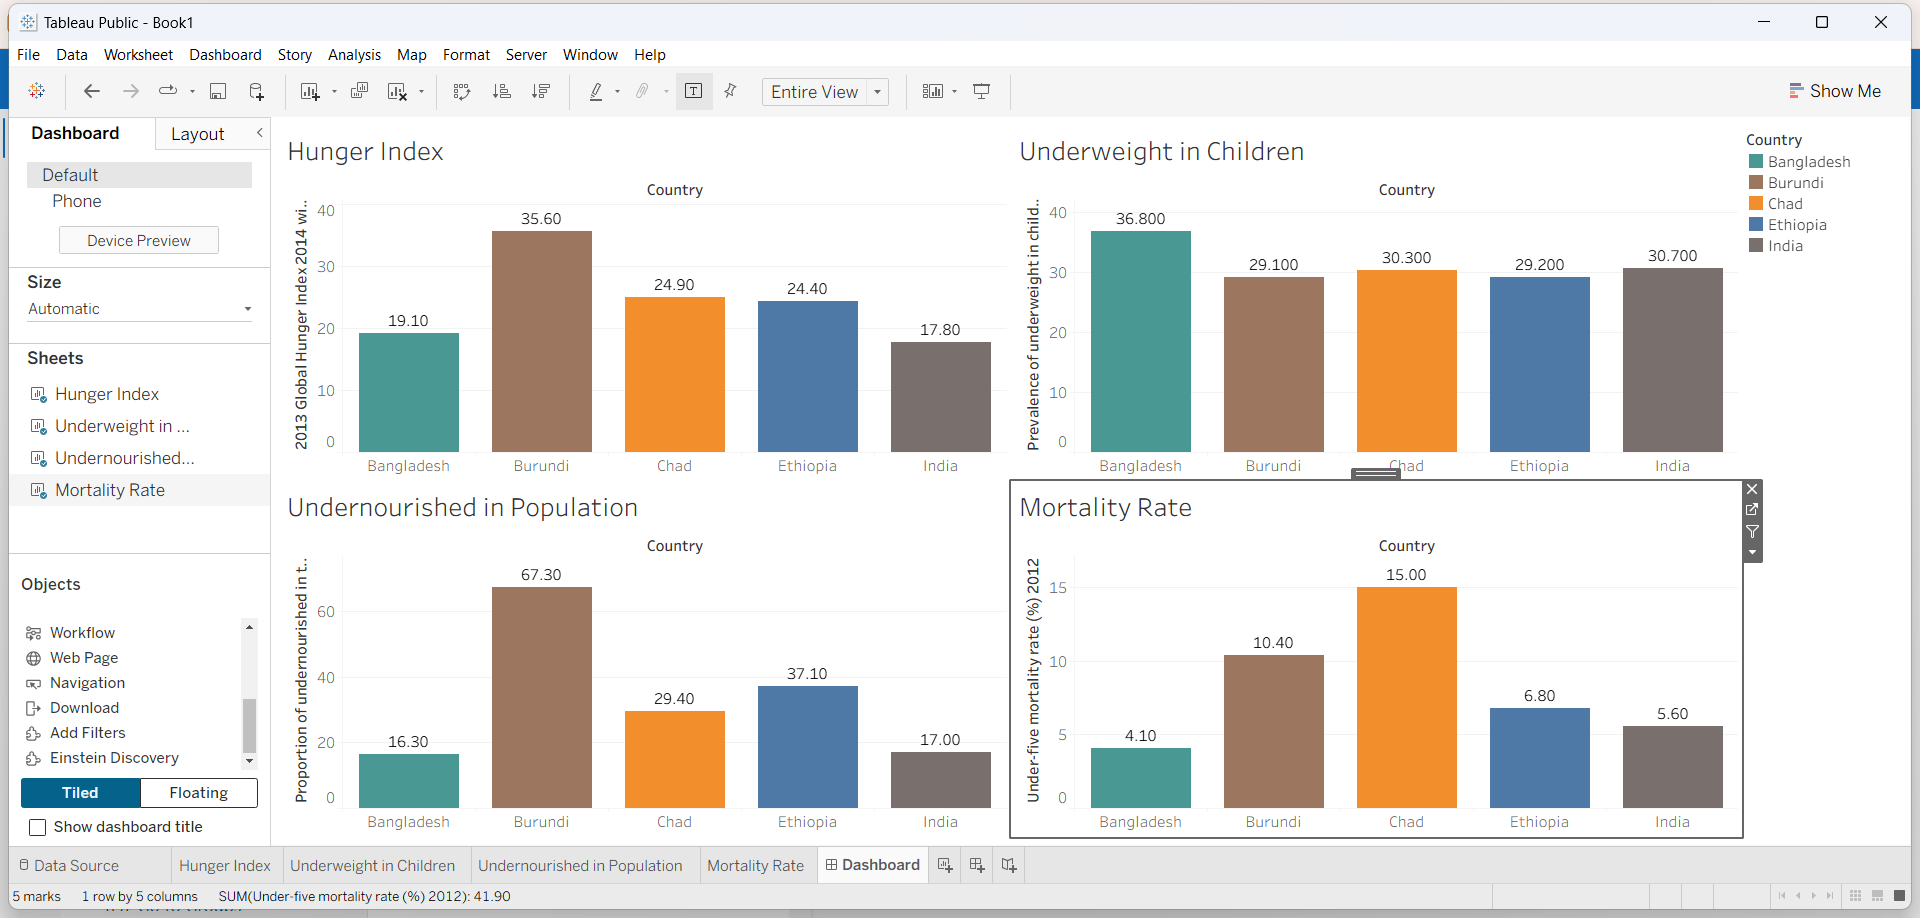
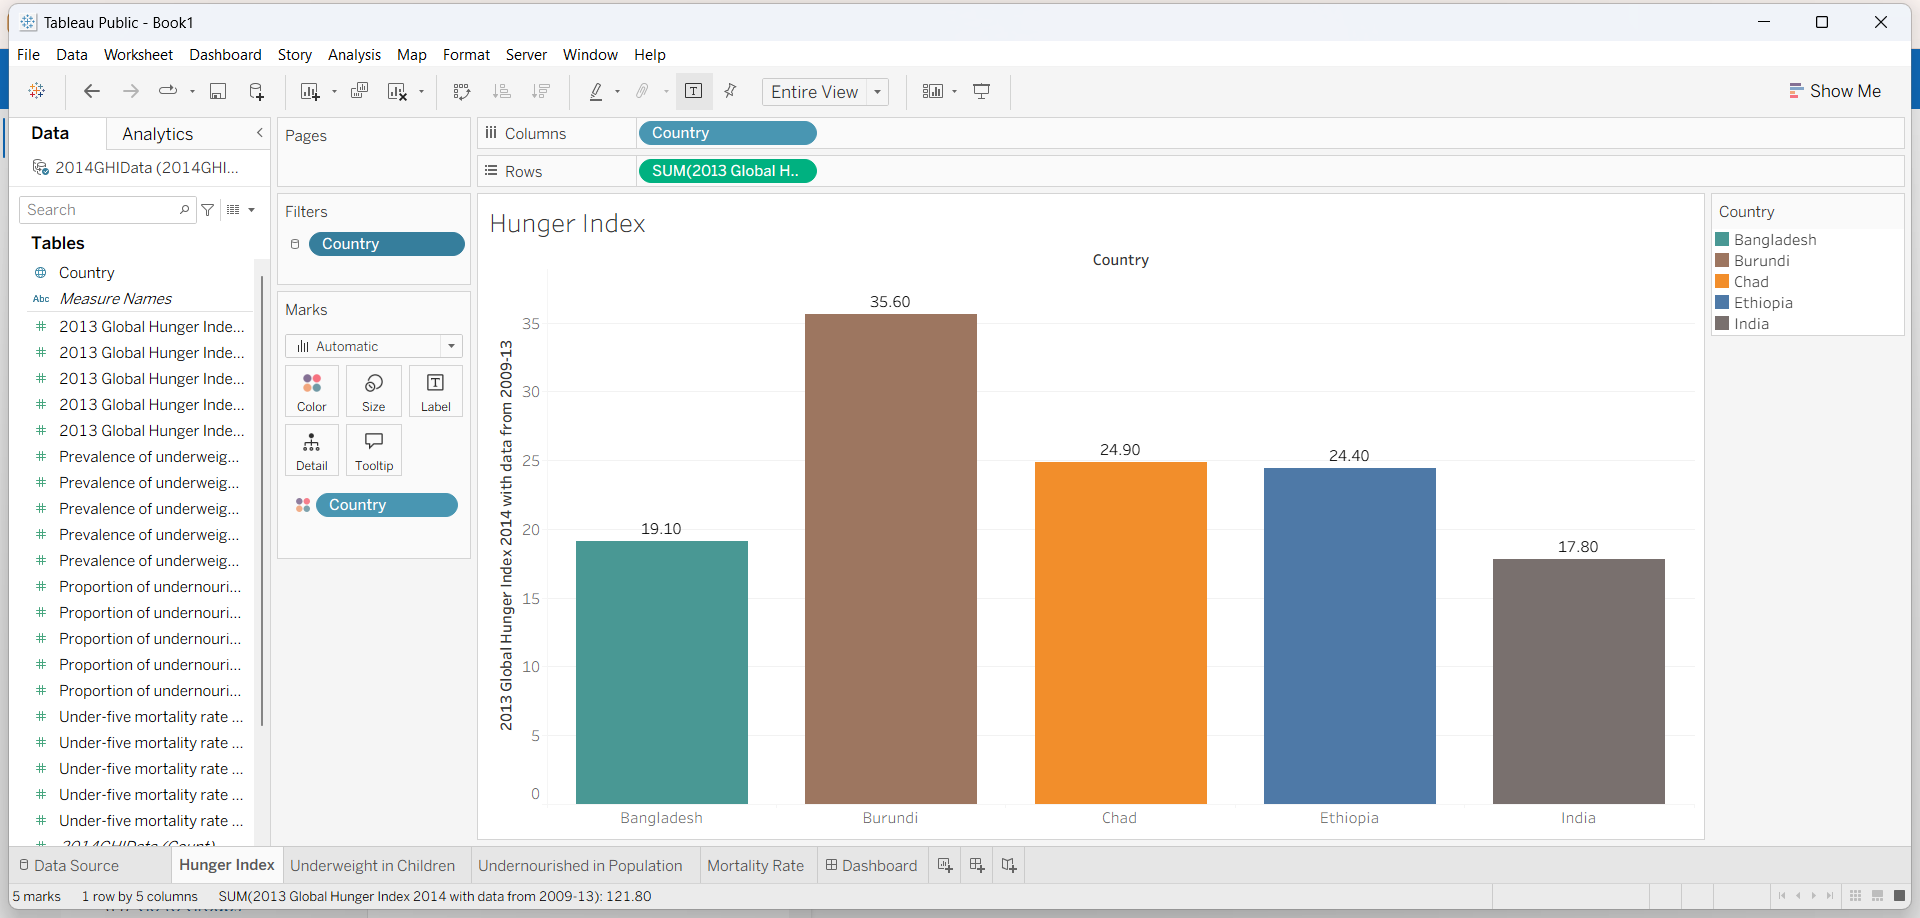
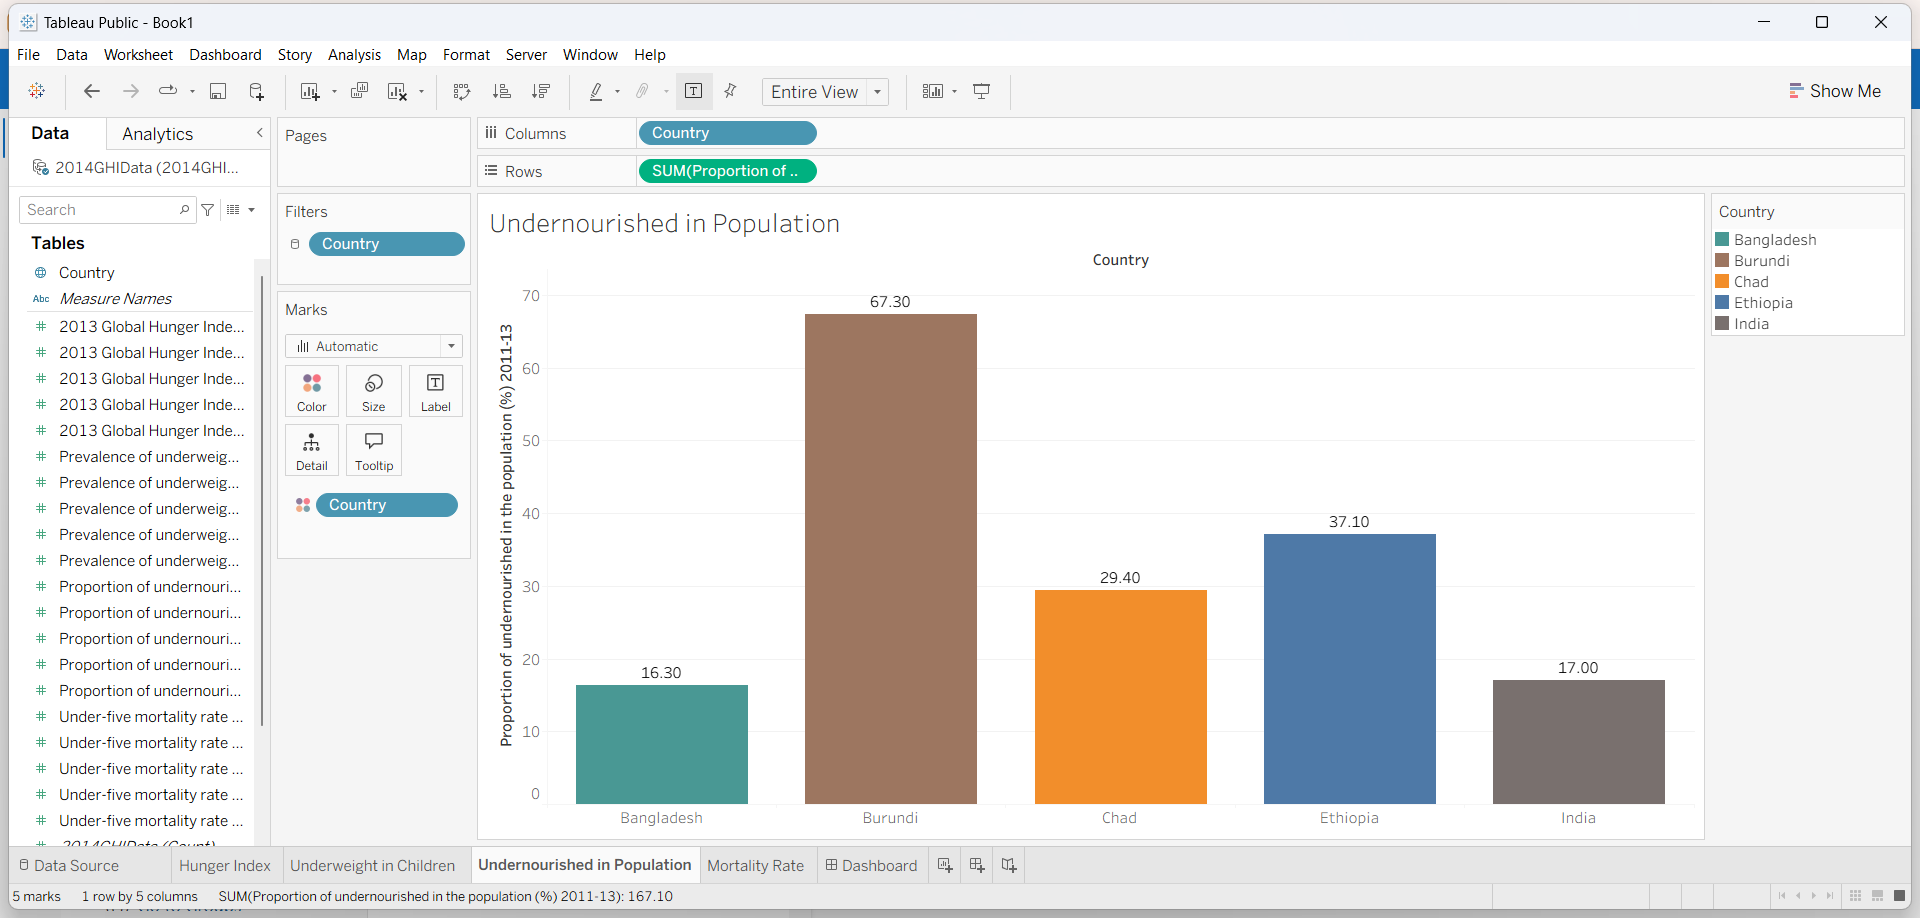
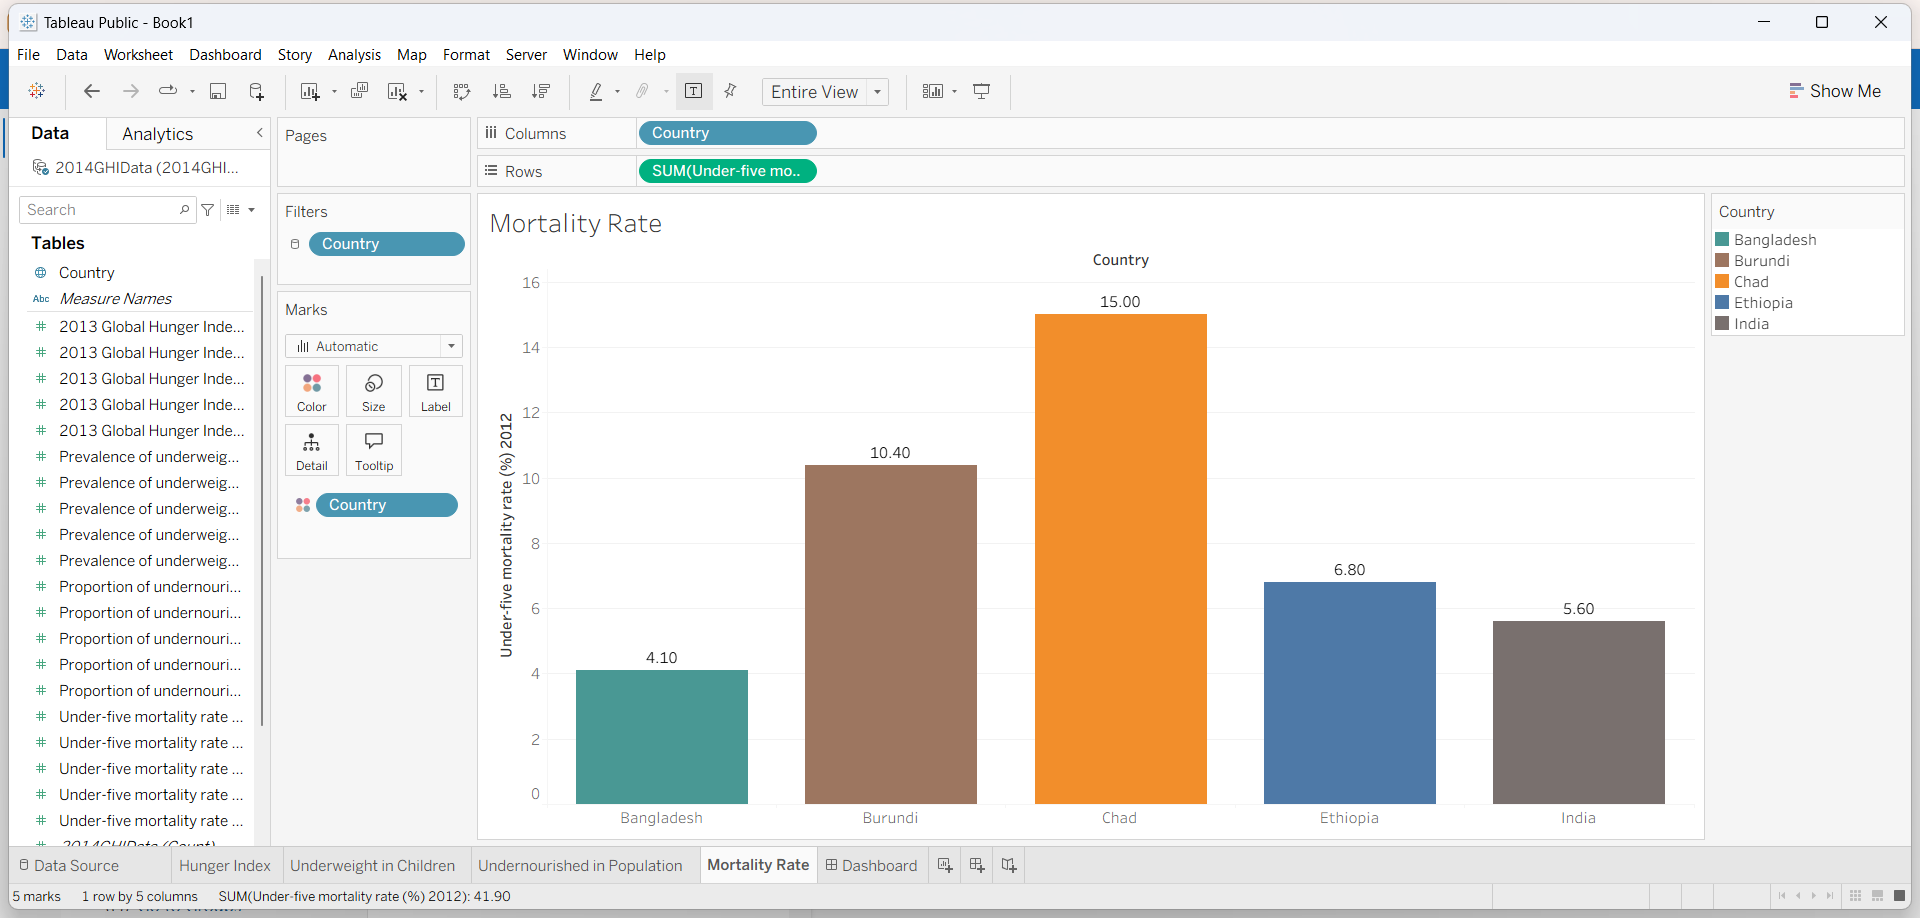
Four indicators behind the 2014 Global Hunger Index, compared across five countries. The same countries appear in the same order in every panel, so you can read across.
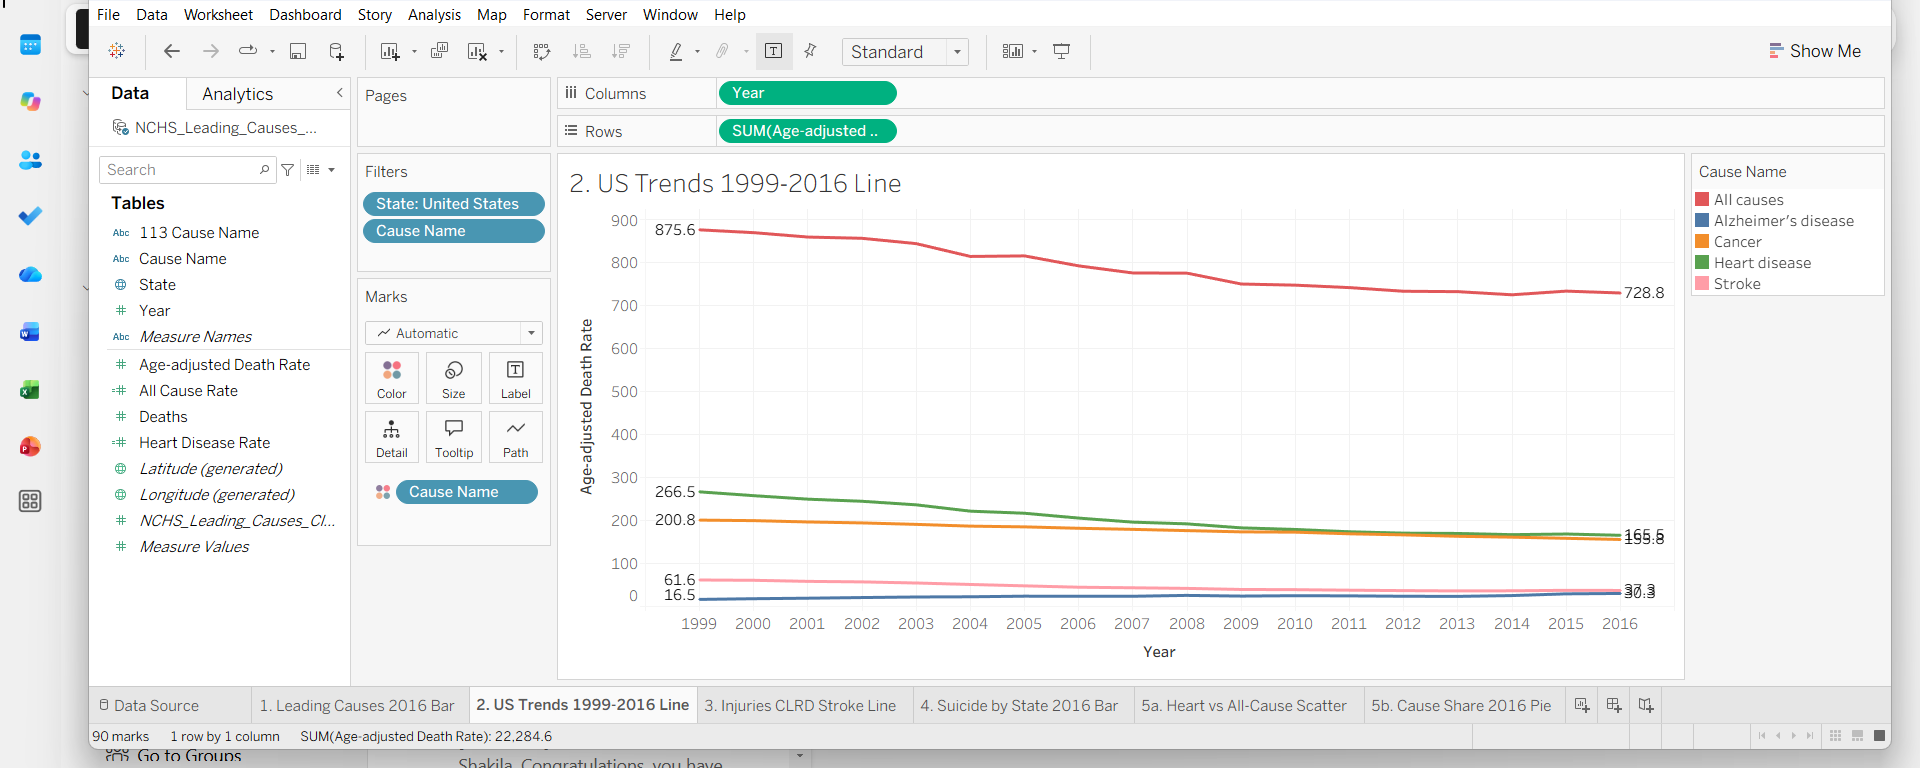
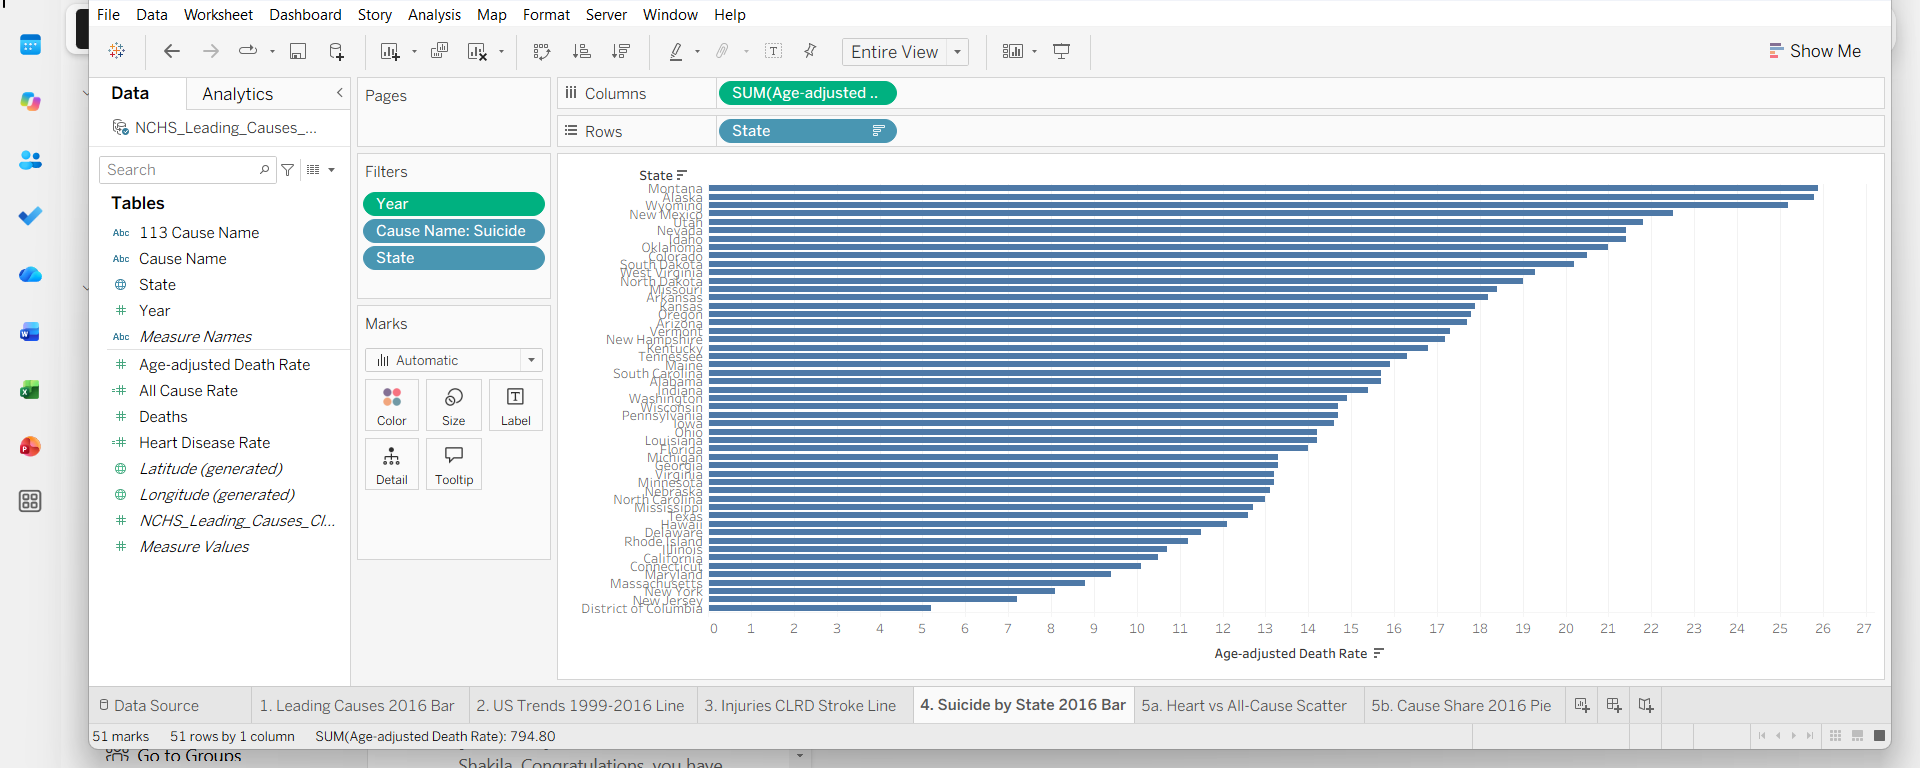
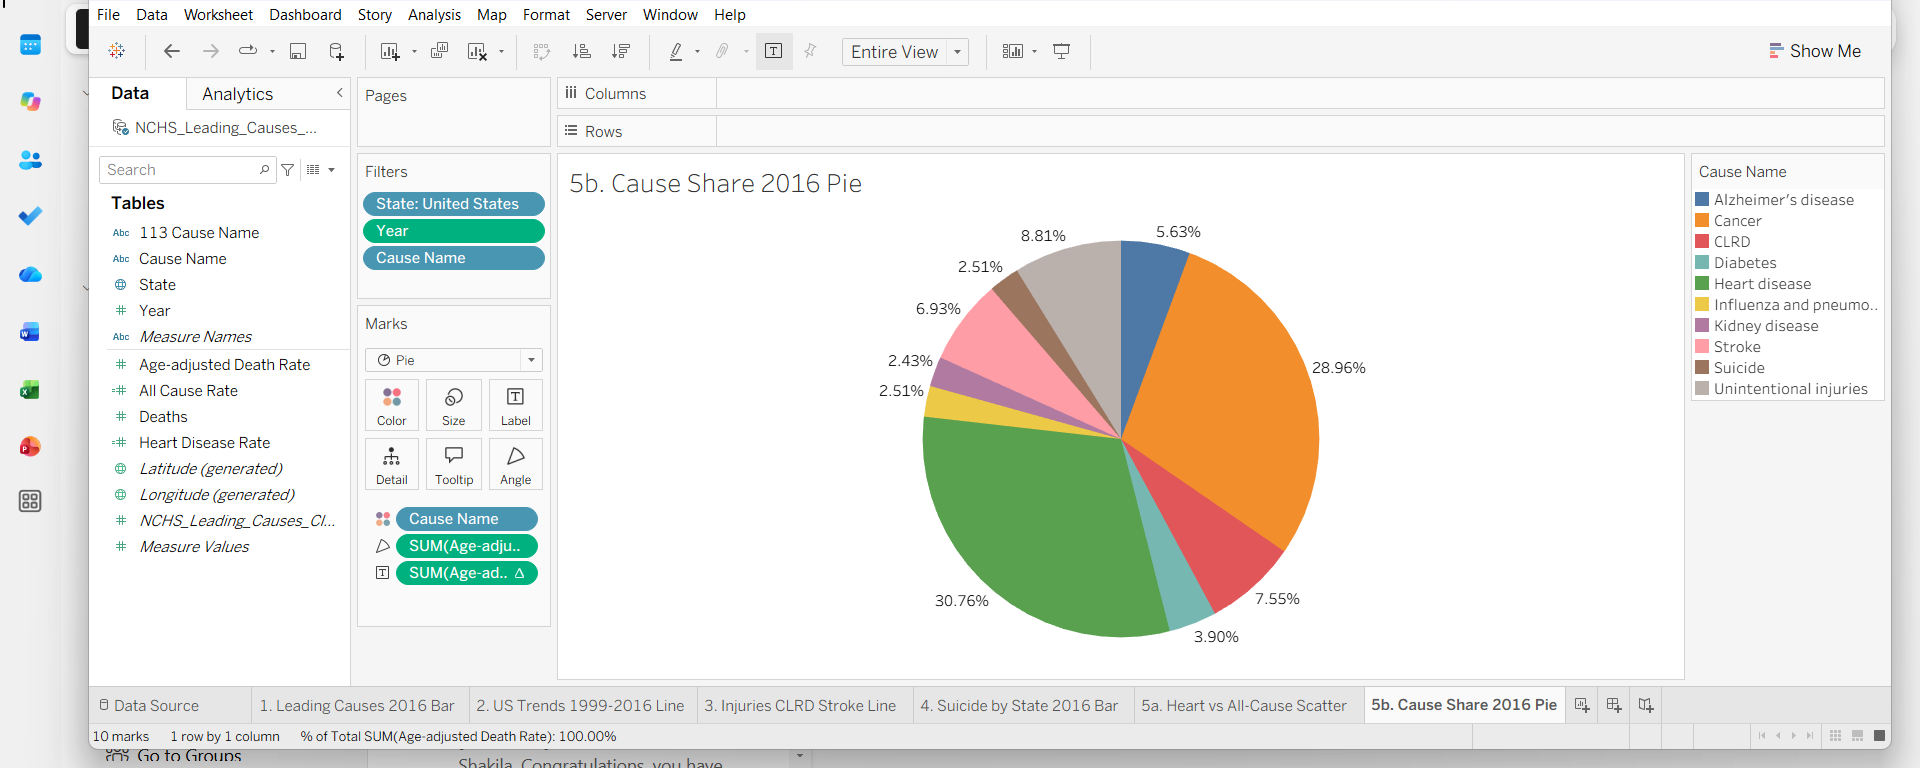
Five findings from the NCHS mortality file. All rates are age-adjusted deaths per 100,000, so states with older populations don't distort the comparison.
Analysis driven by written hypotheses. A 110,880-row CDC survey file was cleaned down to 97,666 usable rows: suppressed values dropped, coordinates split, census regions added. Each hypothesis was then tested in Tableau.
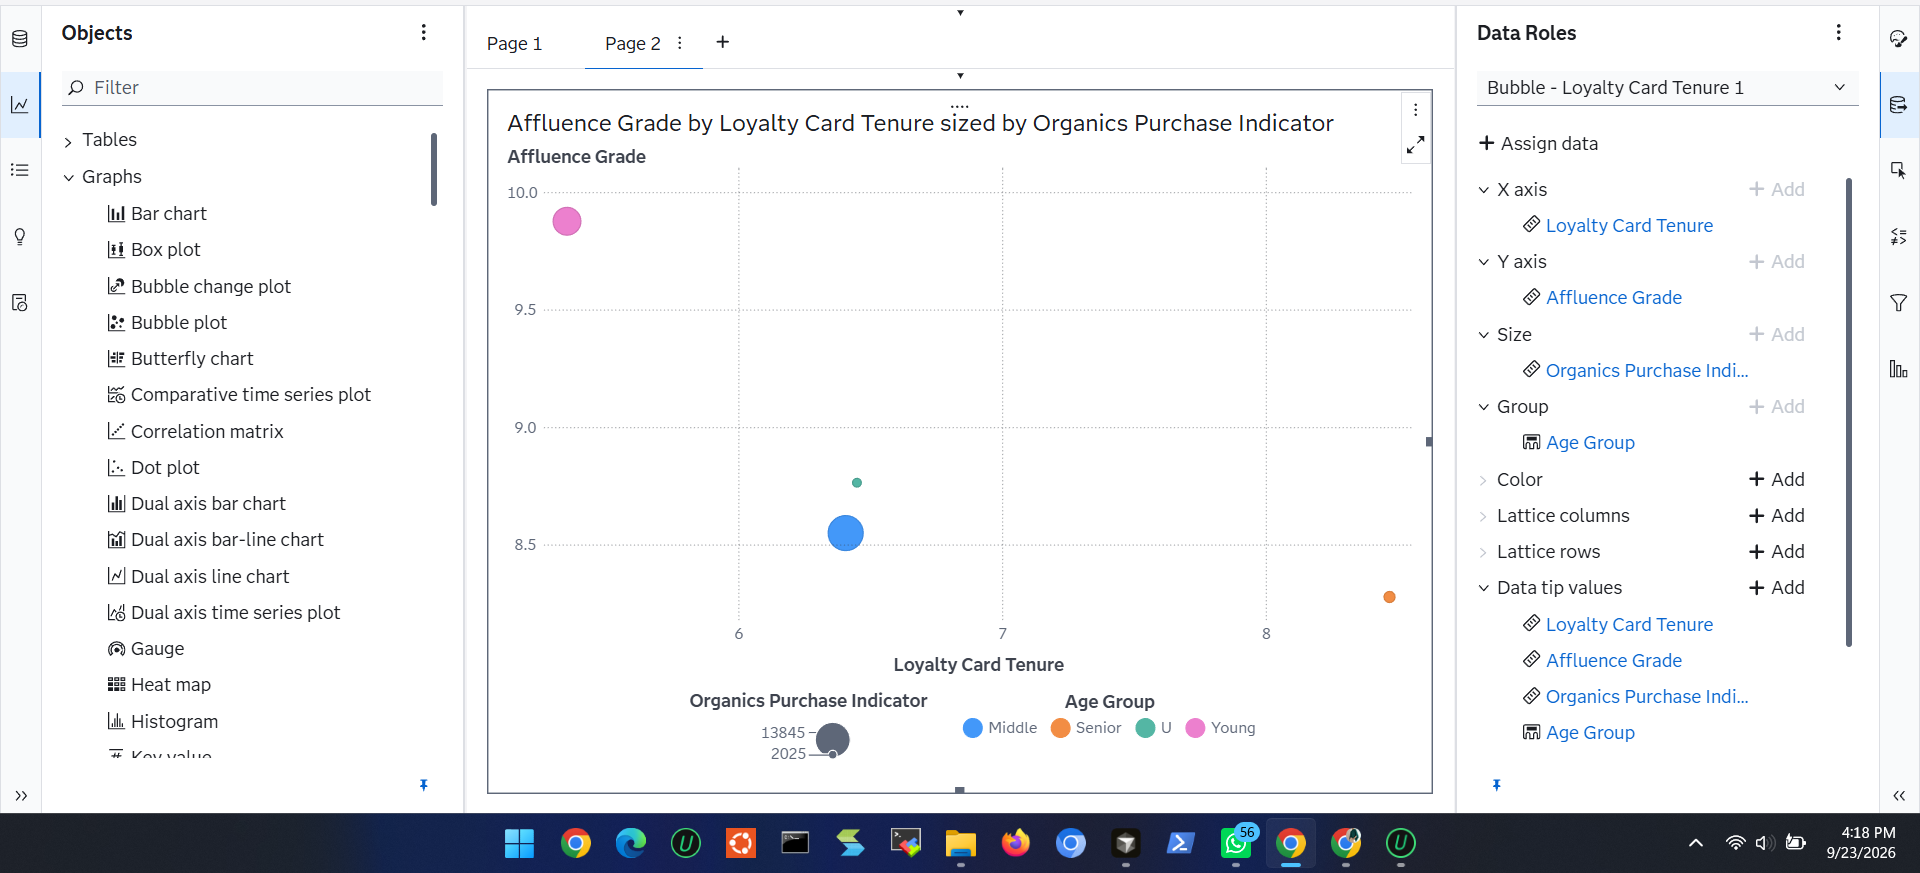
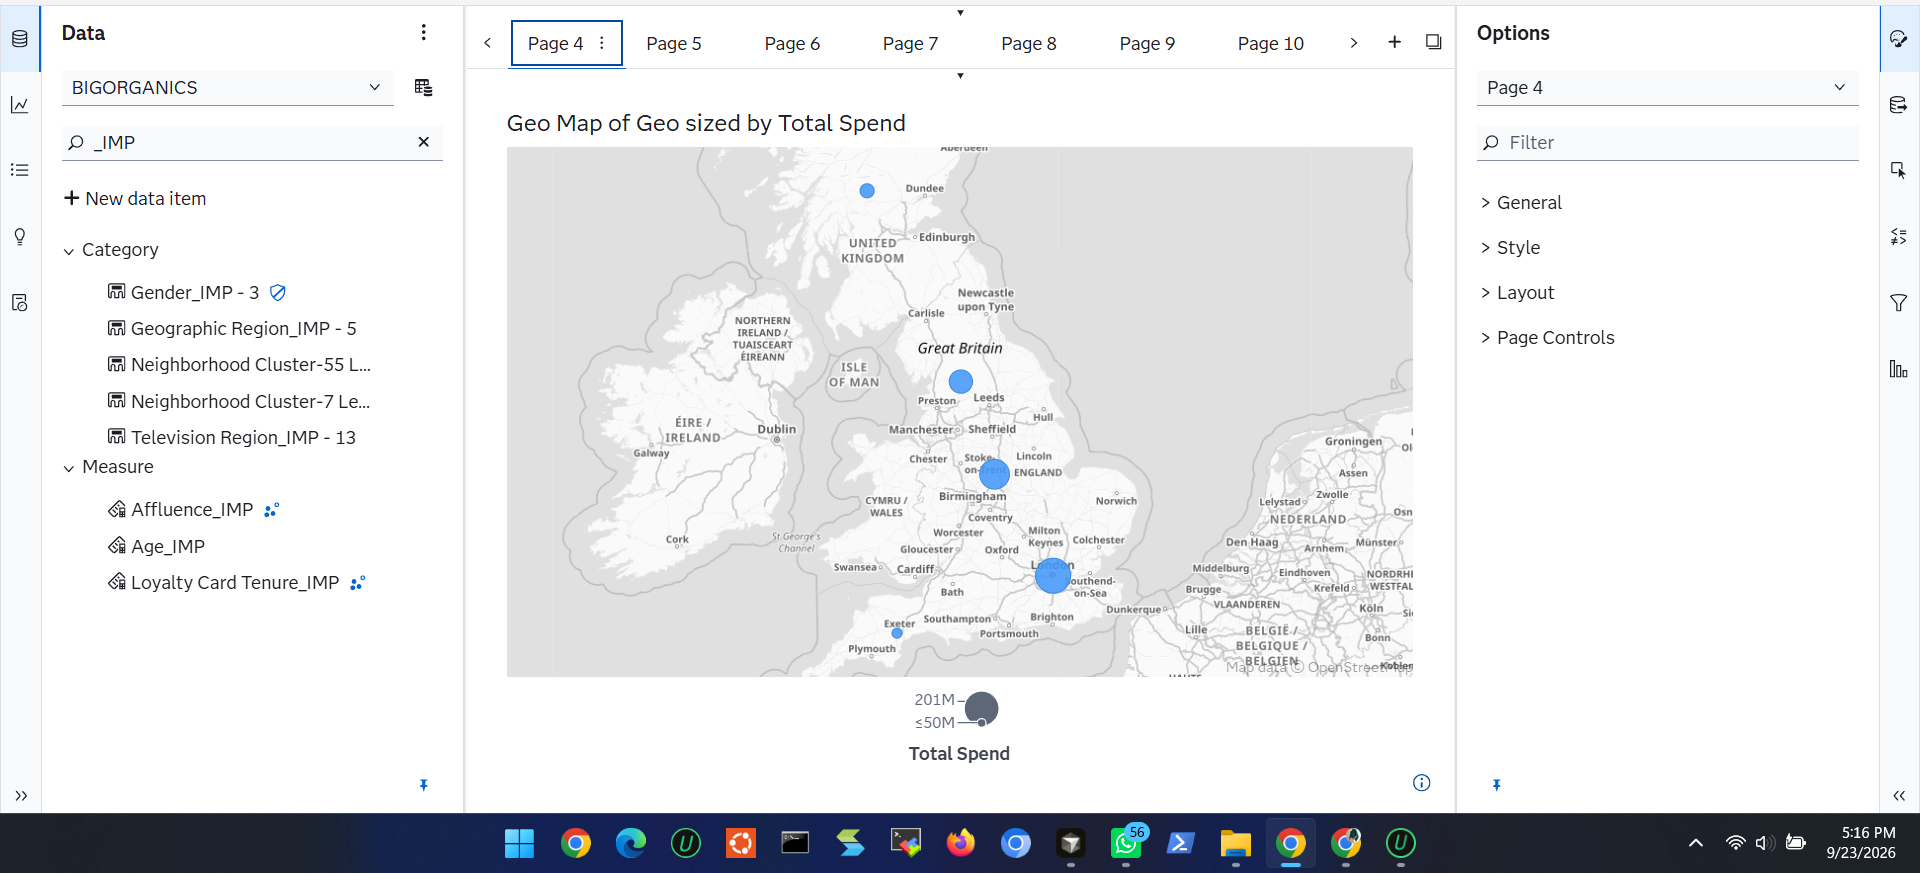
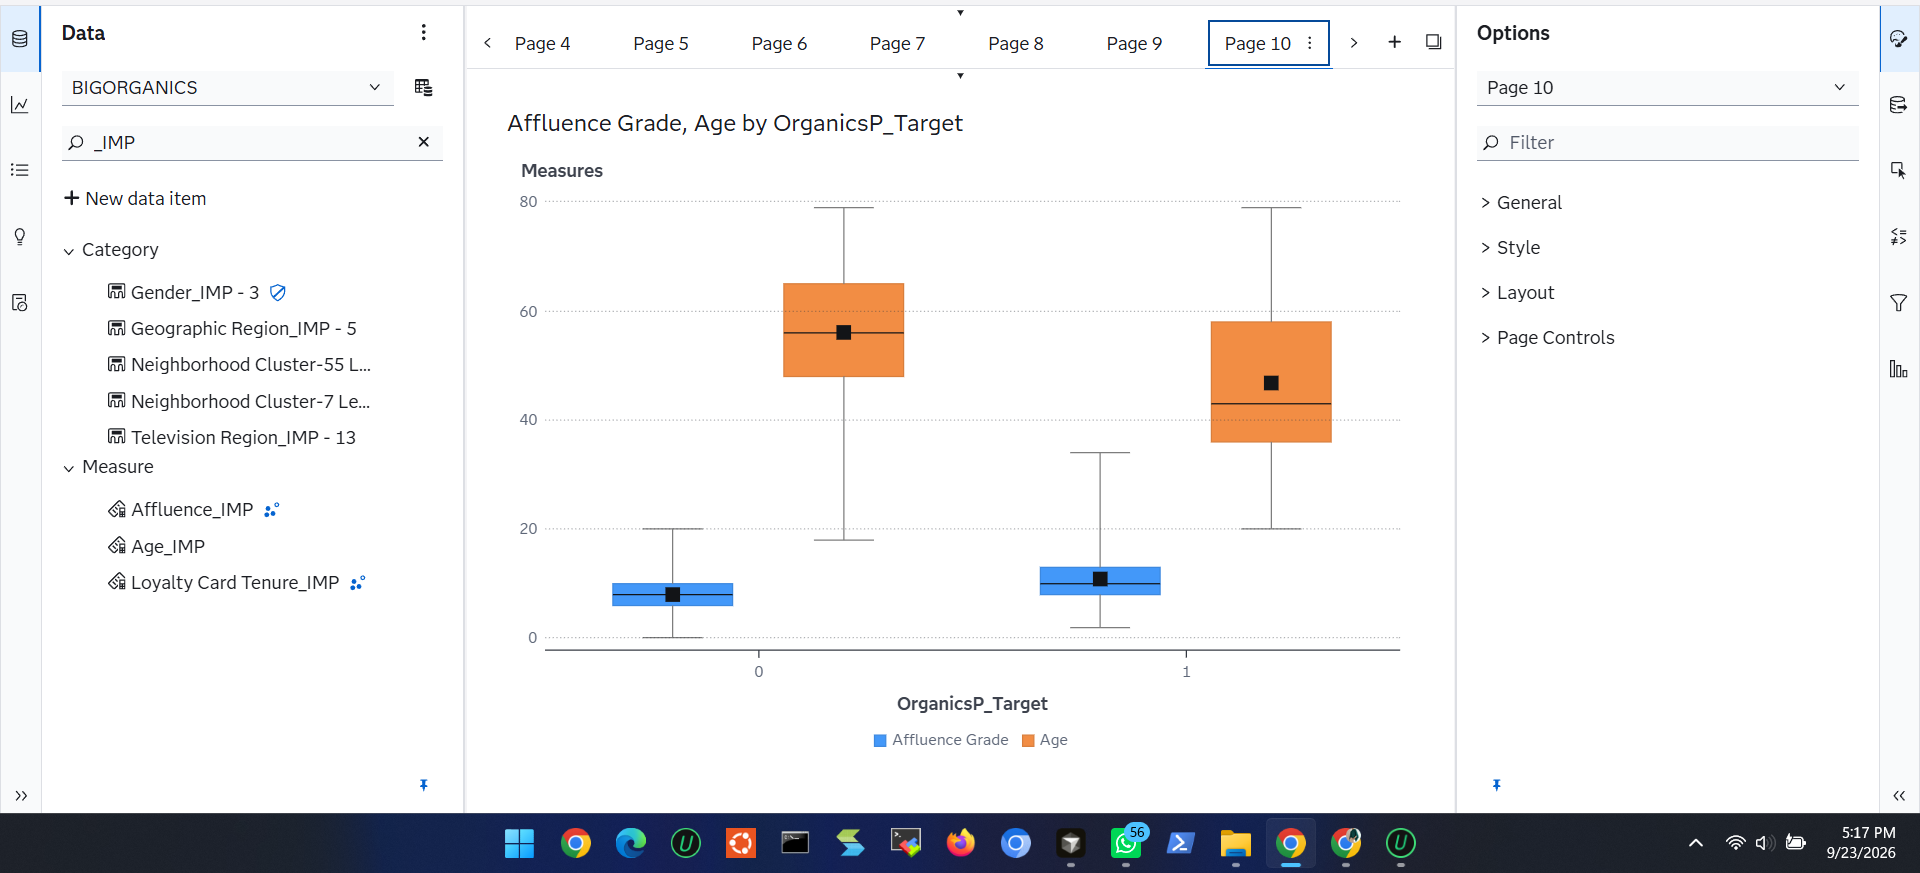
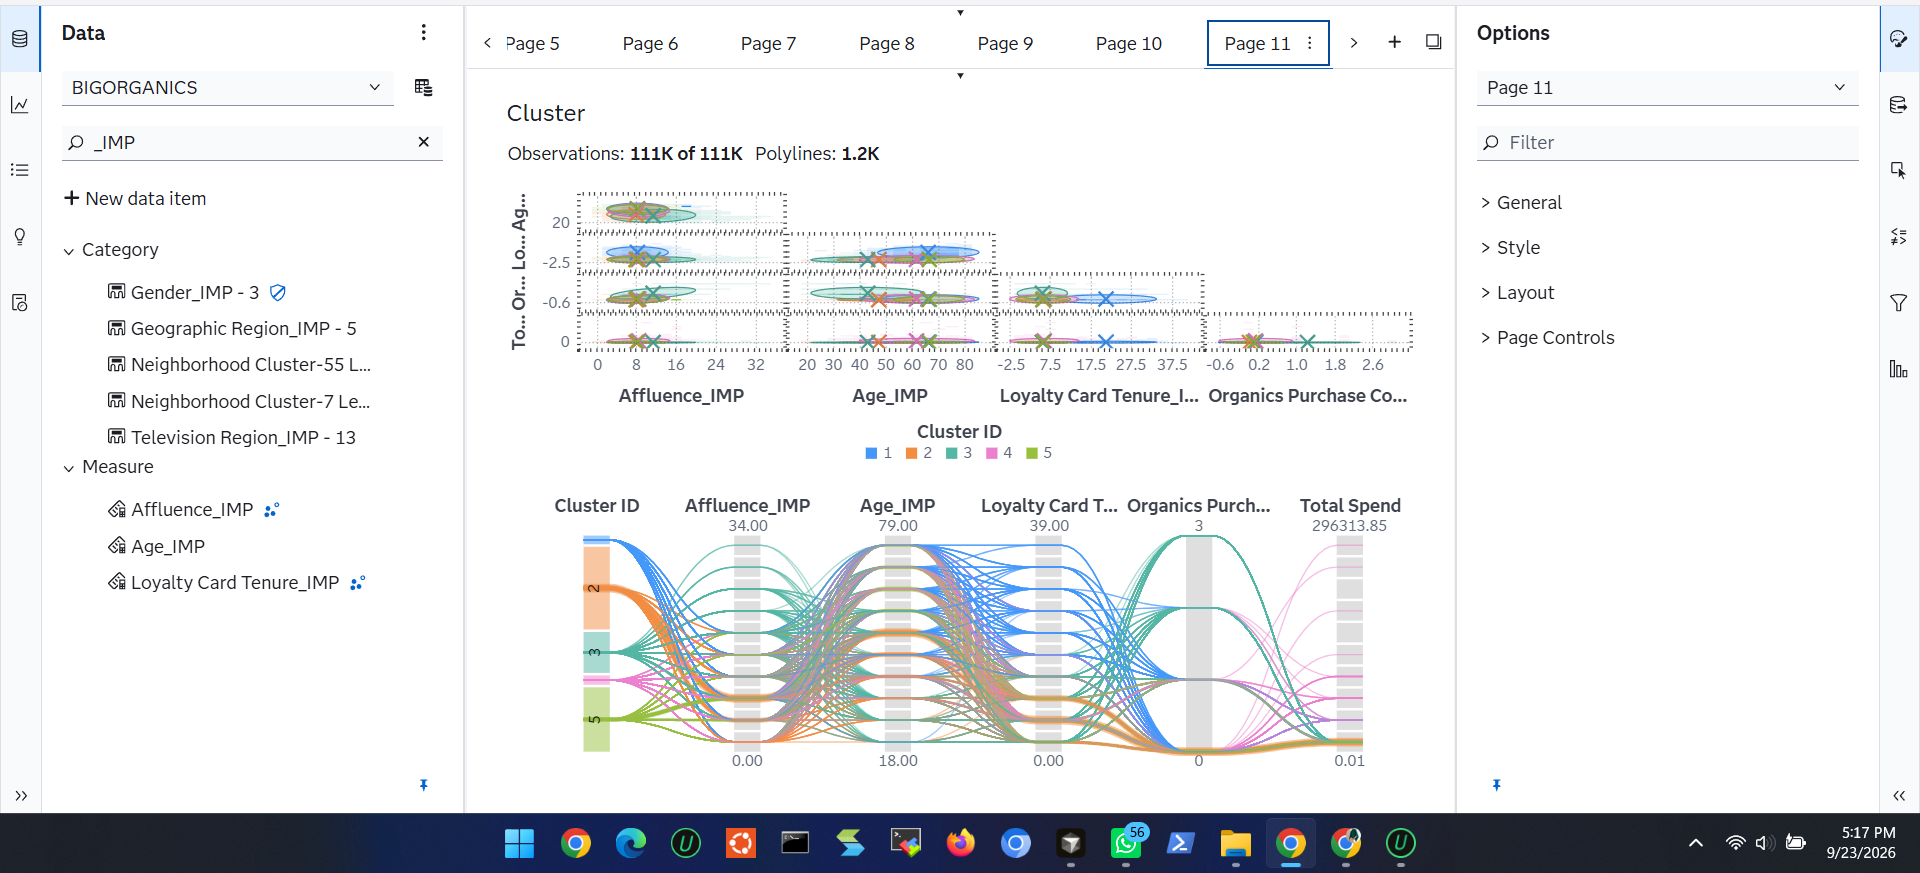
A full SAS Viya workflow: profile the customer base, impute missing values with documented rules, then segment customers and model who buys organic products.
_IMP variables, e.g. Age → 53, Affluence → 8, Gender → UEight executive questions answered from California's HCAI disclosure data. Answers were computed twice, in pandas and as live Excel formulas, and the two matched. The hard part was the data-integrity traps: 444 filed reports describe only 432 hospitals.
k-means clustering (k = 3) finds three cardiovascular risk profiles. A decision tree then traces how risk factors compound toward death from coronary heart disease (CHD).