๐ญ Product Mix Optimizer
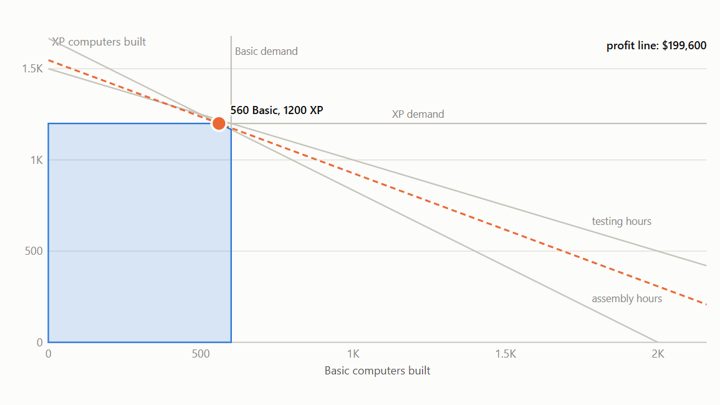
How many of each computer to build under labour and demand limits, plus an 8-model plan and a 6-month production schedule.
Seven interactive models covering the full analyst toolkit: describe the data, find relationships, fit regressions, optimise plans, and decide under uncertainty. Each one runs on the real datasets and re-solves live as you change the inputs.
How many of each computer to build under labour and demand limits, plus an 8-model plan and a 6-month production schedule.
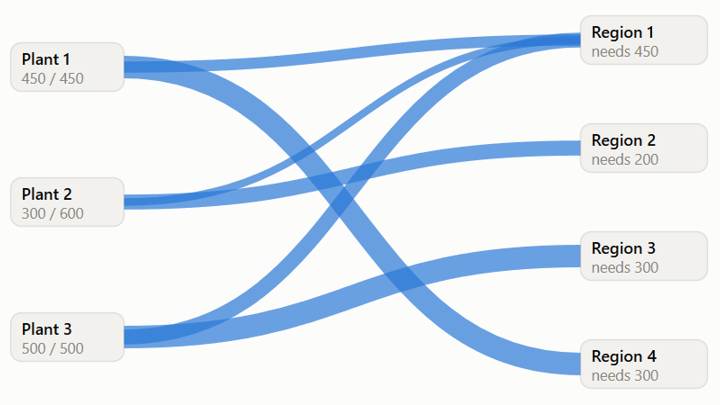
Staff scheduling with whole-number workers, a plant-to-region shipping network, and a five-year investment plan.
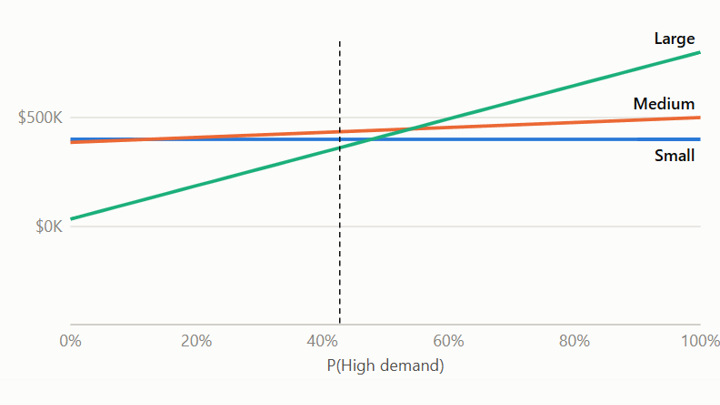
A developer picks a project size before demand is known. Five decision rules, the value of a market forecast, and risk aversion.
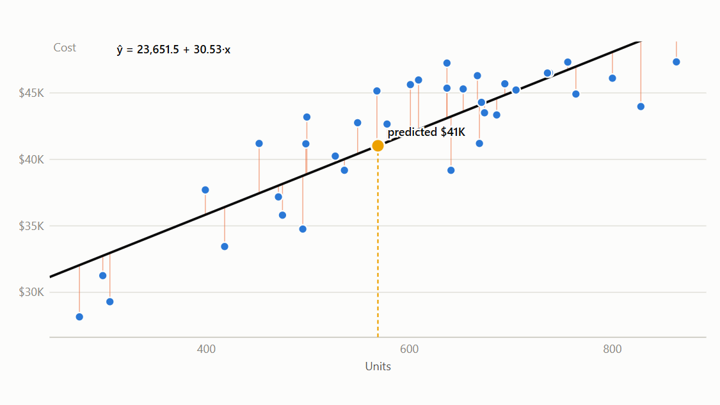
Four business datasets with animated least-squares fits, predictions, multiple regression and confidence intervals.
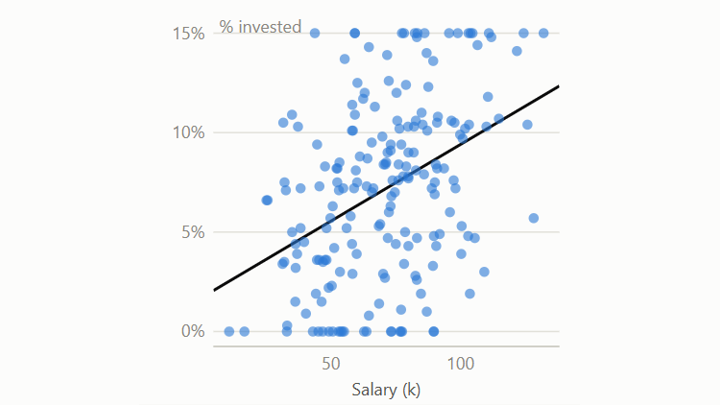
What predicts the share of income 194 couples invest for retirement? Toggle predictors and the model refits live.
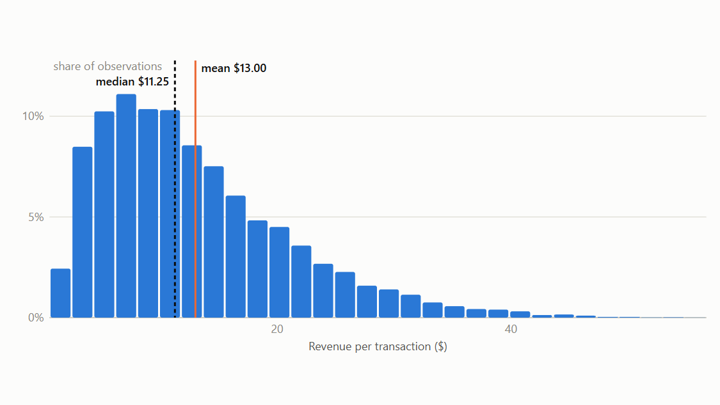
Histograms, box plots and summary statistics for 14,059 supermarket transactions, 379 metro commutes and survey salaries.
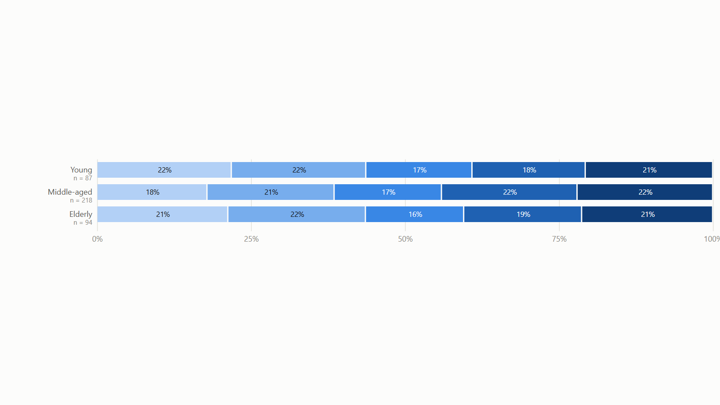
Cross-tabulations of survey opinion by group and a clickable correlation grid of employee salary data.
| Model | Excel answer | In-browser engine |
|---|---|---|
| Two-product mix: maximum profit | $199,600 | $199,600 โ |
| Eight-model mix: maximum profit | $615,812.50 | $615,812.50 โ |
| Six-month production plan: minimum cost | $1,535,562.50 | $1,535,562.50 โ |
| Shipping plan: minimum cost | $176,050 | $176,050 โ |
| Five-year investing: final cash | $286,791.96 | $286,791.96 โ |
| Staff scheduling: fewest workers | 23 | 23 โ |
| Retirement regression: Rยฒ / F | 0.4531 / 52.47 | 0.4531 / 52.47 โ |